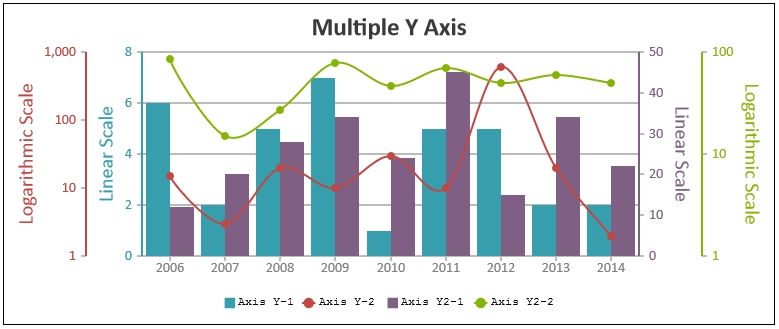
Today we are releasing 1.9.5 Beta 1 with the most requested feature, multiple axes and a few bug fixes. Below is a summary of this release.

New Features & Enhancement
- Secondary X Axis which renders on the opposite side of Primary X Axis (axisX).
- Multiple Y axis which allows you to render Multiple Y Axis and associate different dataSeries to them using axisYIndex.
- Support for Multiple X axis which allow you to render multiple X Axis and associate different dataSeries to them using axisXIndex.
- Print feature has been introduced – becomes available when exportEnabled is set to true.
New Properties
- axisXType allows you to render dataSeries against either primary or secondary X Axis.
- axisXIndex allows you to associate dataSeries to specific axisX.
- axisYIndex allows you to associate dataSeries to specific axisY.
Changes in API
- Axis elements in option can either be an object (single axis) or an array or objects (when you need multiple axis).
- Because of multiple X / Y axis support, all axis parameters in events like rangeChanging / rangeChanged have been changed to array from object.
Bug Fixes
- Culture was not getting applied to ‘#total’ inside indexLabel.
Do download the latest version from our download page and let us know your feedback
Thank You,
Vishwas R
Team CanvasJS
11 Comments
Great work.
While trying 1.9.5.b1, I got below error message. 1.9.2 is working perfectly with the same chart option.
Can you figure it out why?
TypeError: Cannot read property ‘textBlock’ of undefined
at Function.Axis.setLayoutAndRender (canvasjs.js:13884)
at Chart.render (canvasjs.js:2870)
Thanks for your report. We are unable to reproduce the issue, can you please provide the case in which you are getting this error so that we can look into it and resolve it. Can you kindly create jsfiddle with the issue.
This occurs when I create dynamic DOM including chart div without data, then try to render it.
This works with 1.9.2 but NOT with 1.9.5 beta!
Below is short summary of my code.
1. create dynamic chart DOM (layout of the div for the chart)
2. var compiled = $compile(dom)($scope); //compile dynamic DOM
angular.element($(‘#chartId’)).prepend(compiled);
3. create chart option dynamically (line chart, with xy zoom enabled)
4. create the chart with chart option & chart div id created in step 1,2 & 3
var chart = new CanvasJS.Chart(chartId, chartOption);
5. render the chart without data –> at this step, the error occurs
chart.render(); //error!!!
6. bind the data to the chart
We followed the given steps and are unable to reproduce the issue. Please have a look at this jsfiddle and can you update it with the issue?
This is happening to me also with 1.9.5 trial version.
I am using it with Enyo. If I render the chart with no data, it give the same error as above.
I can not duplicate it on the jsfiddle you linked.
I should point out that I first noticed this while making it hide/show line chart series when the legends were clicked. If I make them all invisible, it gets the error.
It also errors if I just call render with the dataPoints set to [].
I have found the problem. It only happens with:
axisY:{
includeZero: false
},
The jsfiddle you linked also fails when this is used.
Hi! Awesome release. One question: Is the Api support for getting the chart as image built in this version? Thanks.
Hi. After configured a segond Y-axis and activated with on my second dataseries, we can see that unchecking a dataseries from the chart, involves that chart disapear completely. Why?
Riber,
The bug has been fixed in v1.9..5.1. Kindly download the latest version and let us know your feedback.