Login to Ask a Question or Reply
Forum Replies Created by Vishwas R
-
Emily,
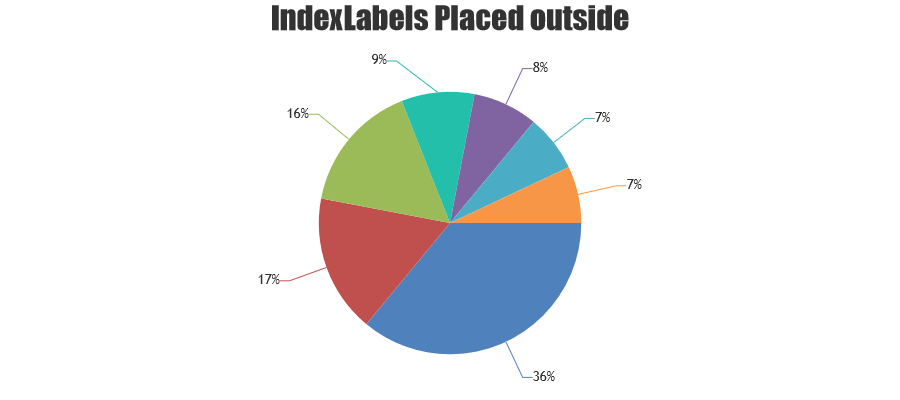
indexLabels are skipped whenever they get closer to other labels – this behavior is by design. You can workaround this issue by either rotating the Pie Chart as shown in this JSFiddle or by showing indexLabel outside the Pie Chart as shown in this JSFiddle – indexLabels are placed better when they are outside.
You can place position the indexlabels inside / outside by setting indexLabelPlacement property and rotate the pie by setting startAngle property.
 November 15, 2016 at 10:37 am in reply to: Combining CanvasJS function : zoom panning and jquery tab #13329
You are re-rendering chart every 15000ms (15seconds), so zoomed level disappears every 15seconds.
function updateChart(){
   $("#chartContainer1").CanvasJSChart(options1).render;
  }

  setInterval(function(){updateChart()}, 15000);
Removing these lines will work fine with zooming functionality within different tabs. Please check this jsfiddle.
[UPDATE]
We have just release v1.9.5GA with multiple axis support. Please refer to the release blog for more information.
Thomas,
Multiple axes will be going GA in a week or two. Please subscribe to our blog for updates.
—
Vishwas R
Team CanvasJSNovember 11, 2016 at 10:16 am in reply to: Interactivity not working even when interactivityEnabled set to true #13310It’s not a bug. ToolTip is a Dom-element, so whenever you assign height to all div elements, it will be applicable even for tooltip. It’s suggested to apply height based on class or id of div.
Are you looking for this?
You can fix the position of toolTip with the help of css. Please check this jsfiddle for the same.
If you like to show values in legend by disabling toolTip, you can set toolTip.enabled to false and change legendText dynamically on mouseover event on every dataPoint. Please check this jsfiddle for the same.
—
Vishwas R
Team CanvasJSUday,
Its not possible to include 0 in logarithmic scale, instead you can set axisY minimum to some negative exponential like 0.001 or 0.00001 according to your requirement.
—
Vishwas R
Team CanvasJSHi,
We will be exposing internal calculated and default values in our future version, using which you can get default colorSet.
Suhail,
You can set axisX minimum to remove padding between first dataPoint and the axisY-line.
Uday,
A logarithmic axis can only plot positive values. There simply is no way to put negative values or zero on a logarithmic axis.
Fundamental: If 10L = Z, then L is the logarithm (base 10) of Z. If L is a negative value, then Z is a positive fraction less than 1.0. If L is zero, then Z equals 1.0. If L is greater than 0, then Z is greater than 1.0. Note that there no value of L will result in a value of Z that is zero or negative. Logarithms are simply not defined for zero or negative numbers.
—
Vishwas R
Team CanvasJSOctober 29, 2016 at 11:20 am in reply to: How can I gather URL parameters to use in a pie chart? #13076Brandon,
Please refer window.location object for more info about your requirement.
You can use stripLines to achieve this. Check this example.
Uday,
Sorry this feature is not available as of now.