Home Forums Feature Requests & Feedback Negative Values with Logarithmic scale

Negative Values with Logarithmic scale

Viewing 4 posts - 1 through 4 (of 4 total)
  • #13116

    I want Y-axis to start from -10 and It should be logarithmic. Is it possible..?

    #13125

    Uday,

    A logarithmic axis can only plot positive values. There simply is no way to put negative values or zero on a logarithmic axis.

    Fundamental: If 10L = Z, then L is the logarithm (base 10) of Z. If L is a negative value, then Z is a positive fraction less than 1.0. If L is zero, then Z equals 1.0. If L is greater than 0, then Z is greater than 1.0. Note that there no value of L will result in a value of Z that is zero or negative. Logarithms are simply not defined for zero or negative numbers.


    Vishwas R
    Team CanvasJS

    #13159

    In my data y value range from 0 – 1000 but most of them lie in 0-200. So, I feel it better if y can be a logarithmic scale. Is there any possibility to include at least zero into y axis..?

    #13161

    Uday,

    Its not possible to include 0 in logarithmic scale, instead you can set axisY minimum to some negative exponential like 0.001 or 0.00001 according to your requirement.
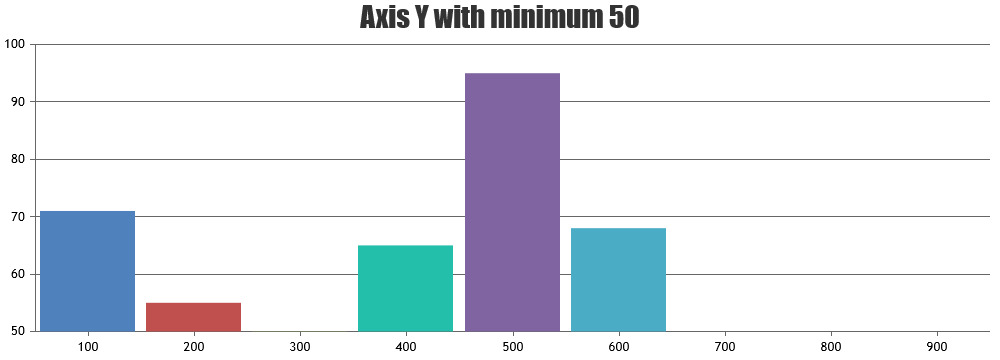
    Setting y-axis minimum


    Vishwas R
    Team CanvasJS

Viewing 4 posts - 1 through 4 (of 4 total)

You must be logged in to reply to this topic.