Login to Ask a Question or Reply
Forum Replies Created by Vishwas R
-
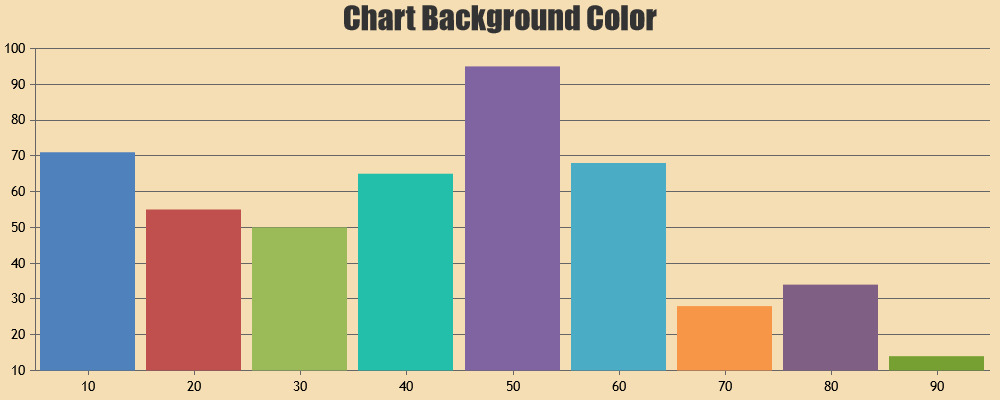
You can use backgroundColor property to change chart background-color, which defaults to white.

Regarding the second query, you can increase the width and height (which is set to 78px and 100px) and change left/top accordingly so that pie is positioned properly.
—
Vishwas RIt seems to be working fine with every browser including Firefox, Chrome, Opera, IE, Visual Studio Internal Browser. Can you kindly provide us some more info like the OS and browser details in which you are facing this issue, so that we can look into it and help you out.

You can set indexLabelPlacement: “inside” to show indexLabels within column.
—
Vishwas RDate-Time support for Y-axis is not available as of now. But as you said, with the help of time-stamp and labelFormatter, you can achieve date-time over y-axis. Please check this jsfiddle.
Another way to achieve this is by rotating the chart-container div with chart axisX as date-time and setting axisYType to secondary. Please refer this jsfiddle.
—
Vishwas RaxisY.maximum seems to be working fine. Please check for typo. If you still find the issue, kindly create jsfiddle so that we can look into the issue and help you out.
—
Vishwas RWe have just released v1.9.6 GA, which allows you to programmatically export chart as image, print chart, access internally calculated values, etc. Please refer to the release blog for more information.
—
Vishwas RThis bug has been fixed and we will be releasing it in couple of days.
—
Vishwas RYou can develop desktop application with embedded browser control that runs your HTML and JS. With this way, you can use CanvasJS within desktop application. Please refer the following links for more information.
http://stackoverflow.com/questions/12232784/how-to-develop-desktop-apps-using-html-css-javascript
http://stackoverflow.com/questions/35677614/html-js-and-css-desktop-applications
https://www.quora.com/How-can-I-develop-applications-in-HTML-CSS-JS-for-desktop-applications—
Vishwas RBryan,
We checked the issue and observed that this work-around doesn’t work along with animationEnabled. Either you can disable animation or after animation completes, you can call chart.render() again as animation doesn’t happen after first chart-render and position image. Please check this jsfiddle.
—
Vishwas RBryan,
Changing
document.getElementsByClassName("canvasjs-chart-canvas")[1]todocument.getElementsByClassName("canvasjs-chart-canvas")[0]will work fine.—
Vishwas RDavid,
Thanks for your query. We are unable to observe any decrease in performance. We will further look into it. Meanwhile can you kindly create jsfiddle with the code that you are using and share the following info so that we can properly look into it.
1. OS details (Name and version)
2. Browser details (Name and version)
3. Zoom-level/panning at which you find performance issue.—
Vishwas RBryan,
This feature is not available as of now. But with few lines of code, you can achieve this. Please check this jsfiddle.
—
Vishwas R