Login to Ask a Question or Reply
Forum Replies Created by Vishwas R
-
Sync Zooming and Panning across Multiple Charts in ‘How To Samples‘ section seems to be working fine.
Please check this jsfiddle for syncing across 3 charts.
Incase, if you are still facing the issue, kindly reproduce the same in jsfiddle, so that we can look into it and help you out.
—
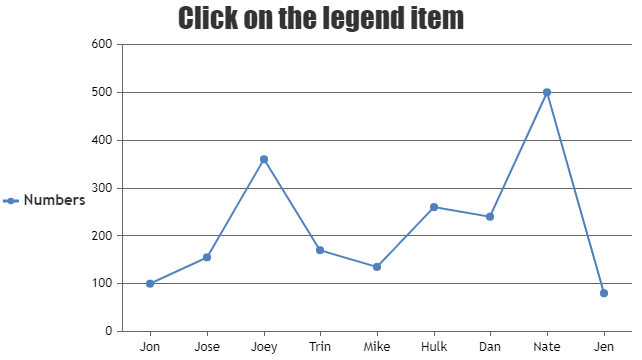
Vishwas RIn multi-series chart, legends are shown to every series when showInLegend is set to true. We checked the same and it seems to be working fine in all versions including latest, v1.9.6.
If you are still facing the issue, can you kindly reproduce the same in jsfiddle, so that we can look into it further and help you out resolving it.
—
Vishwas RIn JavaScript, Date instance is created using
new Date().In your case, changing
$x_axis = date(‘D M d Y H:i:s O’, strtotime($csv[$i][0]));to$x_axis = new Date(‘D M d Y H:i:s O’, strtotime($csv[$i][0]));should work fine.—
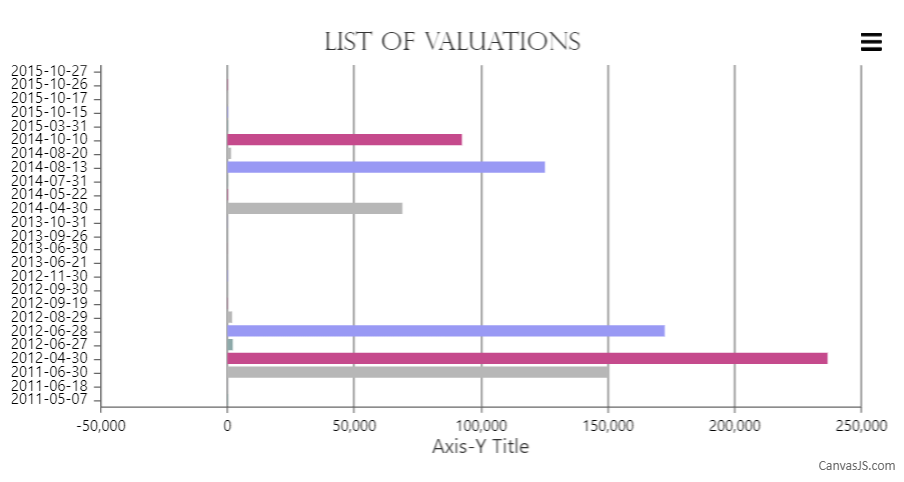
Vishwas R@Vlatka,
As per the code snippet shared above, we can observe that there are a lot of labels with bigger texts because of which some of the axis labels are skipped to avoid overlapping. This can be customized to show all the labels by setting axisX interval property as 1. Code snippet below shows how you can do the same:
axisX: {
    interval: 1
 }
Please take a look at this JSFiddle for a working example with sample code.
—
Vishwas R
Team CanvasJSWe don’t have asp.net webforms samples yet. You can refer to this tutorial on retrieving data from database in C#, convert the retrieved data to the format that’s accepted by CanvasJS and render chart.
—
Vishwas RJanuary 30, 2017 at 12:52 pm in reply to: Removing doughnut label from chart populated from a CSV #14116You can trigger checked event with the help of jquery by subscribing to itemclick events.
Please refer these links.
https://api.jquery.com/checked-selector/
http://stackoverflow.com/questions/7031226/jquery-checkbox-change-and-click-event
http://stackoverflow.com/questions/8423217/jquery-checkbox-checked-state-changed-event—
Vishwas R
Team CanvasJSYou can position stripline label on top of it by adding stripline to axisY2. Please check this updated jsfiddle.
Its not possible to stop drawing line at end of bar itself, but it can be stopped to the end of plotArea where axis-line will be rendered by setting tickLength to 0 (zero).
—
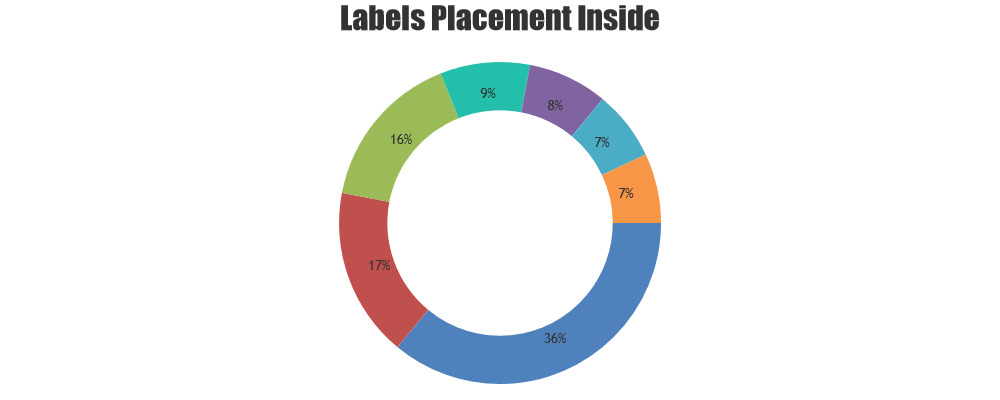
Vishwas RJanuary 20, 2017 at 7:24 pm in reply to: How to add Tooltip Functionality to X-axis labels in in canvajs #14057indexLabelPlacement: “inside” seems to be working fine. Please check this JSFiddle. If you are still facing issue, create a JSFiddle with the issue so that we can look into it and help you out.
—
Vishwas RThanks for the info. We followed the steps you have provided but found its working fine.

Can you kindly share the sample project with the issue, so that we can look into it and help you out?
We are unable to reproduce the issue at our end even in Edge in debug-mode.

Can you kindly share your browser version and steps to reproduce the issue?
—
Vishwas R