Today we are releasing 1.9.6 GA. Below is a summary of this release.
Highlight of Version 1.9.6
- New Methods and Properties have been added which allows you to programmatically export chart as image, print chart, access internally calculated values, etc. You can also access Chart Elements like Title, Axis, DataSeries, ToolTip, Legend, etc using dot notation.
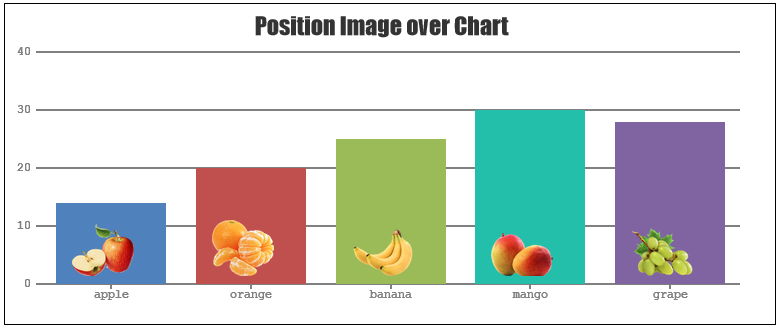
- Important new methods to note are convertValueToPixel and convertPixelToValue – available in all Axis Elements. Here is an example of positioning image over chart.
Bug Fix:
- In IE8, title and labels were rendering with black background as background was transparent by default.
Please read v1.9.6 Beta 1 Release Blog for complete list of features that are available in 1.9.6.
Do download the latest version from our download page and let us know your feedback.
Thank You,
Bivek Singh
Team CanvasJS
Comment
Hello, as I can make for them graphic is updated automatically from a database or sheet of calculation excel. Example is graphic in bars.