Login to Ask a Question or Reply
Forum Replies Created by Vishwas R
-
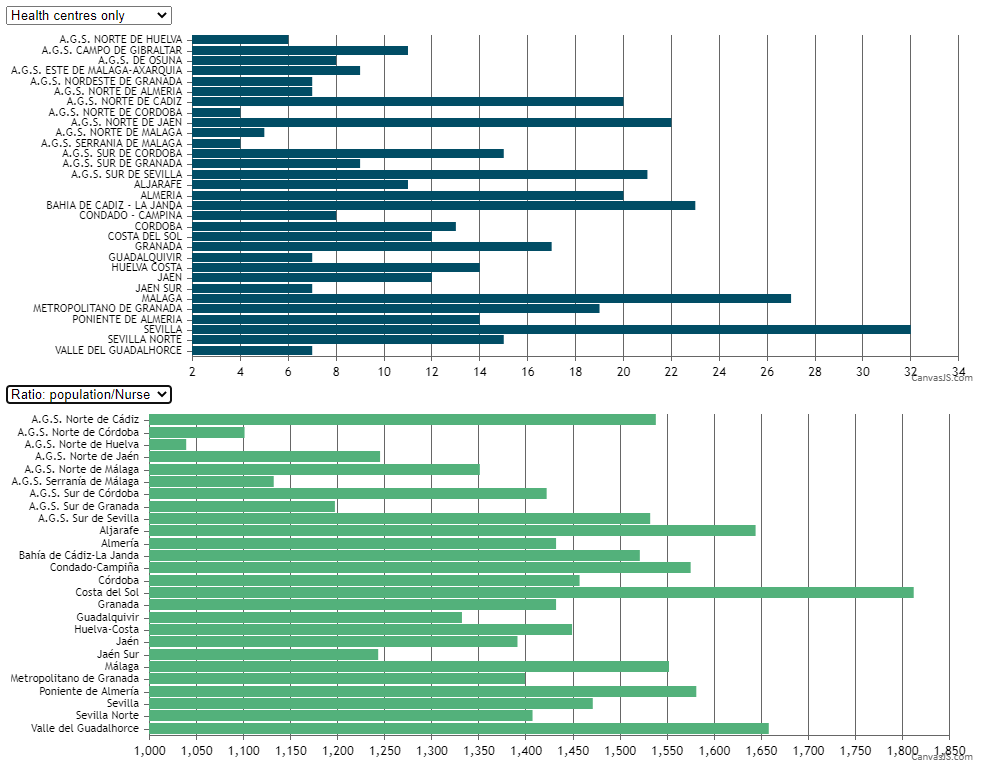
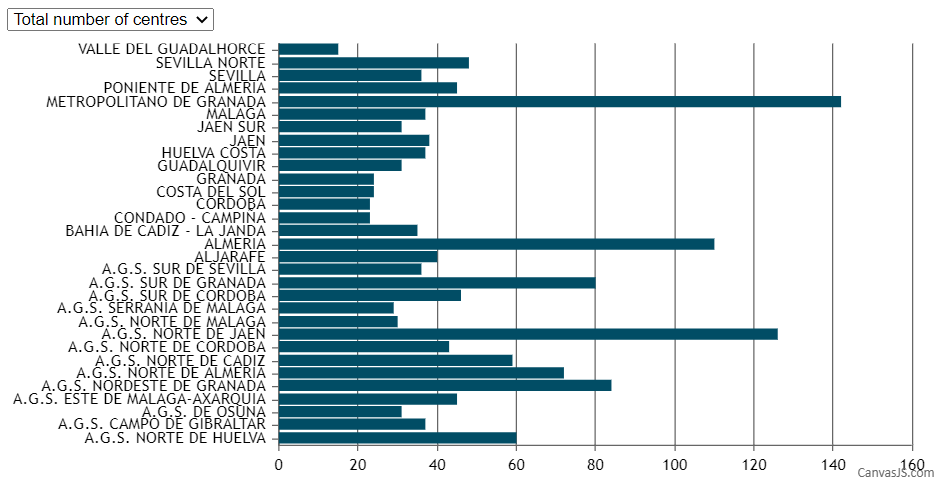
You just need to have separate charts for each dropdowns as shown in the code snippet below –
var dataPoints1 = [];
var chart1 = new CanvasJS.Chart("chartContainer1", {
	animationEnabled: true,
	axisX: {
		interval: 1,
		labelMaxWidth: 1000,
		labelFontSize:11,
		reversed: true
	},
	axisY2:{
		interlacedColor: "rgba(1,77,101,.2)",
		gridColor: "rgba(1,77,101,.1)",
		title: ""
	},

	data: [{
		type: 'bar',
		color: "#014D65",
		//xValueFormatString:"D MM h:mm",
		name: "series1",
		dataPoints: dataPoints1 // this should contain only specific serial number data

	}]
});

$( "#dd" ).change(function() {
	chart1.options.data[0].dataPoints = [];
	var e = document.getElementById("dd");
	var selected = e.options[e.selectedIndex].value;
	dps = jsonData1[selected];
	for(var i in dps) {
		chart1.options.data[0].dataPoints.push({label: dps[i].label, y: dps[i].y});
	}
	chart1.render();
});

var dataPoints2 = [];
var chart2 = new CanvasJS.Chart("chartContainer2", {
	animationEnabled: true,
	axisX: {
		interval: 1,
		labelMaxWidth: 1000,
		labelFontSize:11,
		reversed: true
	},
	axisY2:{
		interlacedColor: "rgba(1,77,101,.2)",
		gridColor: "rgba(1,77,101,.1)",
		title: ""
	},

	data: [{
		type: 'bar',
		color: "#53B17B",
		//xValueFormatString:"D MM h:mm",
		name: "series1",
		dataPoints: dataPoints2 // this should contain only specific serial number data

	}]
});

$( "#second" ).change(function() {
	chart2.options.data[0].dataPoints = [];
	var e = document.getElementById("second");
	var selected = e.options[e.selectedIndex].value;
	console.log(selected)
	dps = jsonData2[selected][0];
	for(var i in dps) {
		chart2.options.data[0].dataPoints.push({label: dps[i].label, y: dps[i].y});
	}
	chart2.render();
});
Please take a look at this updated jsfiddle.
—
Vishwas R
Team CanvasJSThe json in the fiddle that you have shared has label and y-value, where as while parsing the json you are trying to read x-value and y-vlaue out of it. Replacing x-value with label while parsing should work fine in your case.
chart.options.data[0].dataPoints.push({label: dps[i].label, y: dps[i].y});Please take a look at the updated jsfiddle.
—
Vishwas R
Team CanvasJSThe horizontal bars at the top right corner is shown when exportEnabled property is set to true, that is used to export chart as image. Setting exportEnabled to false will remove those horizontal bars.
—
Vishwas R
Team CanvasJSTrial Version is for evaluation purposes for up to 30 days. Please contact sales@canvasjs.com for license & sales related queries.
—
Vishwas R
Team CanvasJSJames,
You can achieve this by changing axis minimum and maximum based on selected range like weeks or months etc. Please take a look at this jsfiddle.
—
Vishwas R
Team CanvasJSThanks for your interest in CanvasJS. For all sales related queries, please contact sales@canvasjs.com.
—
Vishwas R
Team CanvasJSDecember 18, 2017 at 9:52 am in reply to: Chart not showing; Trial version in the bottom left corner #18304Thanks for your interest in CanvasJS. Providing the proper path of the script should work fine in your case.
Also, since this is a web app anyway (requires Internet), if I purchase the license, will the Trial version in the bottom left corner of the chart gone?
Yes, commercial version comes without ‘Trial Version’ watermark. Please contact sales@canvasjs.com for more license / sales related queries.
—
Vishwas R
Team CanvasJSSubhasis Ghosh,
Thanks for your interest in CanvasJS. For all sales related queries, please contact sales@canvasjs.com.
—
Vishwas R
Team CanvasJSSubhasis Ghosh,
Please download JSP Samples from Download page. The sample also includes examples with AJAX. You can run those examples in Eclipse locally.
—
Vishwas R
Team CanvasJSThanks for the suggestion. I will discuss this with the team regarding this behavior for future versions. AS of now, you can set axisY margin to show label completely. Please check this updated jsfiddle.
—
Vishwas R
Team CanvasJSIt seems to be working fine, please check the screenshot below.

As you are setting labelWrap to false, labelMaxWidth for crosshair label will be limited to the space available for corresponding axis. Setting crosshair.labelMaxWidth would work fine in this case. Also you can set axisY.margin along with crosshair.labelMaxWidth if the crosshair label is getting clipped.
If this doesn’t solve the issue you are facing, kindly create a jsfiddle with the issue you are facing so that we can understand it better and help you out.
—
Vishwas R
Team CanvasJSYou can sync crosshair & toolTips across charts by getting the pixel co-ordinates from the first chart & then triggering an event in second chart and so on. You can use convertValueToPixel() and convertPixelToValue() methods to get the pixel co-ordinates & corresponding values. Here is a jsfiddle for the same. Please note that there may be a slight variation in x-value as pixel co-ordinates are used.
—
Vishwas R
Team CanvasJSWe observe that the date-time format you are using is not a valid one. Please refer this link for valid JavaScript date-time formats.
You can use valueFormatString to format values (date in your case) that appear on axis labels. Please take a look at this updated jsfiddle.
—
Vishwas R
Team CanvasJSVineet Deodhar,
Profile pics in CanvasJS site are linked from Gravatar. When a user doesn’t have Gravatar account or image, it will fallback to the default Gravatar image which is shown as your profile pic now.
Please create a profile in Gravatar and associate avatar images to your email-id, which you have used to sign-up in CanvasJS site. This will update the same in your CanvasJS profile.
—
Vishwas R
Team CanvasJS