Login to Ask a Question or Reply
You must be logged in to post your query.
Home › Forums › Chart Support › Dynamically build a linear chart from JSON with date?
Dynamically build a linear chart from JSON with date?
- This topic has 7 replies, 5 voices, and was last updated 8 years, 8 months ago by
iscrac.
Tagged: data loading
-
October 15, 2017 at 4:42 pm #17308
Help please draw up a chart from JSON. JSON example here, I need a regular chart.
I used all the examples on this site – my knowledge is not enough to do right.-
This topic was modified 8 years, 9 months ago by
dimas19801.
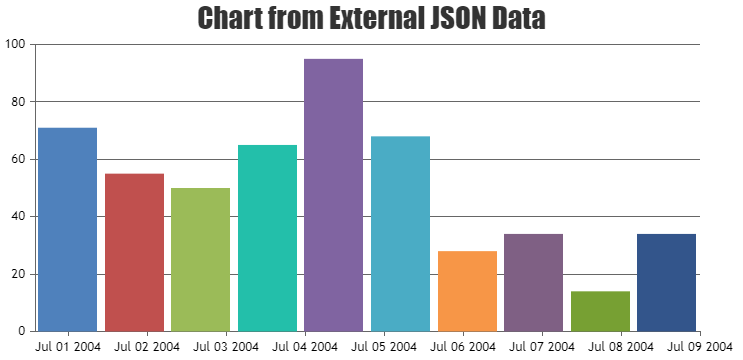
October 16, 2017 at 10:49 am #17310Please refer Tutorial on Creating Charts from JSON Data & AJAX.
The JSON data needs to parsed before passing it to chart-options. Check out the below code snippet for the same.
$.getJSON("https://api.npoint.io/6be170cb804361d314e3", function(chartData) {
	for(var i = 0; i < chartData.length; i++){
  	dps.push({ x: new Date(chartData[i].x), y: chartData[i].y});
  }
	chart = new CanvasJS.Chart("wtChart", {
  	title: {
    	text: "Chart from External JSON Data"
    },
    data: [
      {
        type: "column",
        dataPoints: dps
      }
    ]
  });
  chart.render();
});
Please check this JSFiddle for complete code.
—
Vishwas R
Team CanvasJSOctober 16, 2017 at 10:17 pm #17322Thank you very much! You are best. there was a problem with the headers on my side with JSON.
November 12, 2017 at 5:47 pm #17529I’m trying to build a temperature over time line graph.
I can almost get it to work, the problem with using MySQL + PHP + JSON is parsing the time in hh:mm format via JSON. Parsing time as a unix timestamp works but I can’t change the format to hh:mm. Maybe it’s a basic issue of JSON wanting numerals not strings.Can anyone suggest a way to do this?
Currently the MySQL query and $dataPoints array are built using this:
if(mysqli_num_rows($result_set) > 0){
while ($row = mysqli_fetch_assoc($result_set)) {
$tempF = $row[“outTemp”];
$tempC = ($tempF-32)/1.8;
$tempDateTime = date(‘H:i’, $row[“dateTime”]);
// $tempDateTime = $row[“dateTime”]; //This works- $tempDateTime seen as a numeral, not a string.
echo sprintf(‘%s %0.1f℃’, $tempDateTime, $tempC );
array_push($dataPoints, array(“x” => $tempDateTime, “y” => $tempC));
}
}And the script is the standard ChartJS example code:
$(function () {
var chart = new CanvasJS.Chart(“chartContainer”, {
theme: “theme2”,
zoomEnabled: true,
animationEnabled: true,
title: {
text: “Performance Demo – 10000 DataPoints”
},
subtitles:[
{ text: “(Try Zooming & Panning)” }
],
data: [
{
type: “spline”,
dataPoints: <?php echo json_encode($dataPoints, JSON_NUMERIC_CHECK); ?>
}
]
});
chart.render();
});Can anyone suggest a way to parse time information from PHP to javascript via JSON?
Thanks in advance,
MikeNovember 13, 2017 at 11:38 am #17531The issue seems to be regarding the formatting of Date and Time. Please refer to this documentation page to format Date and Time.
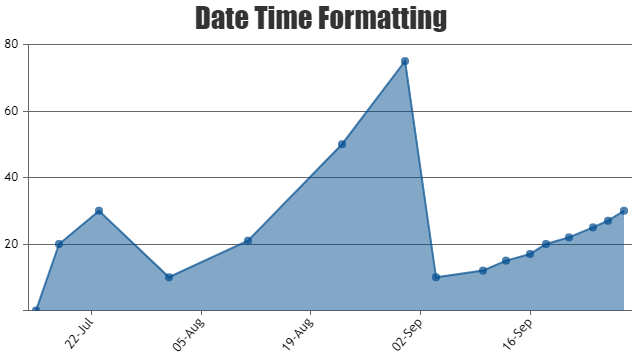
Also, please refer to this stackoverflow link to parse Unix timestamp to javascript timestamp.
In case you are looking for something else, can you please create jsfiddle with sample JSON data reproducing the issue so that we can understand your requirement better and help you out.
__________
Indranil Deo,
Team CanvasJSNovember 14, 2017 at 7:10 pm #17564Hi!
I have one question not about this topic (because I still don’t know how to create a new topic)…
Is there a function, that will load data by showing the grid?
I mean when I load data to trend, plot is not available (white page) untill all data were loaded… but I would like to see the plot area while data is loading…Thanx in advance!
-
This reply was modified 8 years, 8 months ago by
November 15, 2017 at 11:00 am #17578The interval, axisLabel, and gridLines are dependent on dataPoints. Hence till the dataPoints are loaded the mentioned elements cannot be calculated.
However you can display text loader berfore rendering the chart. please take a look at this JSFiddle.

__________
Indranil Deo
Team CanvasJSNovember 15, 2017 at 11:34 am #17579I wanted to do the same thing, but I thought there is another way…
Thanx so much! -
This topic was modified 8 years, 9 months ago by
Tagged: data loading
You must be logged in to reply to this topic.