Login to Ask a Question or Reply
Forum Replies Created by Vishwas R
-
So inside this class widgetContainer I am adding another class ( run time ) and there I have to inject the chart.
In the jsfiddle that you have shared, we don’t see any container with class-name being added dynamically. Can you kindly create jsfiddle reproducing your issue, so that we can understand your scenario better and help you out?
—
Vishwas R
Team CanvasJSWe are working on the issue. We will give you an internal build once it’s fixed – in couple of days.
—
Vishwas R
Team CanvasJSAlex,
Sorry, we don’t have 3D charts in our roadmap as of now.
—
Vishwas R
Team CanvasJSChetna,
Do you mean you you are unable to export CanvasJS Chart as image using Canvas2Image? If so, you can exportEnabled property to export chart as image in jpeg/png formats.
If this doesn’t solve your issue, can you kindly create jsfiddle reproducing the issue so that we can look into it and help you out?
—
Vishwas R
Team CanvasJSThanks for reporting bug along with jsfiddle. We are looking into the issue and fix it in future releases.
—
Vishwas R
Team CanvasJSCrosshair labels are showing real value due to x-values in the datapoint. You can remove x-values to show actual label in crosshair or you can use labelFormatter as shown in this updated jsfiddle.
—
Vishwas R
Team CanvasJSCan you kindly create jsfiddle with sample data so that we can understand your scenario better and help you out?
—
Vishwas R
Team CanvasJSYou can use labelFormatter to customize labels to be displayed on axis. Please take a look at this jsfiddle.
If this doesn’t fulfill your requirements kindly share a pictorial representation so that we can understand your requirements better and help you out.
—
Vishwas R
Team CanvasJSMichaelp,
Sorry, this feature is not available as of now.
—
Vishwas R
Team CanvasJS1) If series start not from the same data-point position and use label approach you suggested, then label displays not correctly
https://jsfiddle.net/tn2u0650/32/ but if adds empty elements as stub for missing points then chart looks good https://jsfiddle.net/tn2u0650/31/You can use x-value along with labels to align all data-points based on x-values properly. Please take a look at this updated JSFiddle.
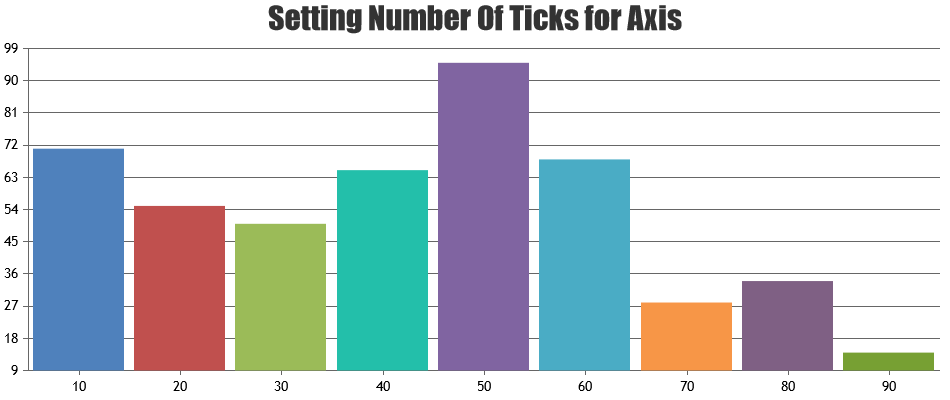
2) If set interval to 1 then chart looks bad for big range, for instance if we have 800 items than all range from 1 till 800 will be displayed on X-asix
Calculation of axis interval depends on various factors like axis-minimum, axis-maximum, number of labels that can be shown within that range of axis, length of axis etc. When you set interval to a value, it doesn’t auto-calculate instead accepts the value that you have assigned irrespective of range, number of data-points and length of axis. You can either remove hard-coded interval so that it will be auto-calculated or you can calculate based on range, number of ticks as shown in this JSFiddle.
—
Vishwas R
Team CanvasJSSorry positioning individual indexLabel is not available as of now. However you can create custom DOM elements for each indexLabel and position them as shown in this jsfiddle.
—
Vishwas R
Team CanvasJSI am facing different issue lines are too close to each other and it is hard to read
Lines look too close as all values from different dataSeries are almost close to each other. You can make it look better by removing indexLabels, as you can show its value in toolTip.
p.s. also my % in tooltip is not working.
#percent and #total keywords works in case of stacked, pie and doughnut charts only.
—
Vishwas R
Team CanvasJSYou can store dataSeries name in ViewBags just like how you are doing it for data and read it in view
ViewData["name"] = item.name;.If this doesn’t fulfill your requirements, kindly share working project along with sample data, so that we can look into it and help you out.
—
Vishwas R
Team CanvasJSThere are some mismatch in chart-container id and export-button id. Please take a look at this updated jsfiddle.
—
Vishwas R
Team CanvasJS