Login to Ask a Question or Reply
Forum Replies Created by Vishwas R
-
The sample code that you have shared also seems to be working fine. Can you kindly share the Working Sample Project reproducing the issue you are facing and also kindly brief us what do you mean by ‘not working’? Also can you check browser-console for any error?
—
Vishwas R
Team CanvasJSWe are yet to receive mail from your side regarding this issue. I request you to upload sample project along with sample database to Google-Drive / Onedrive and share the link over here, so that we can look into your code and help you out?
—
Vishwas R
Team CanvasJSCan you kindly create JSFiddle / Working Sample Project reproducing the issue you are facing and share it with us (You can share Sample Project over Google-Drive / Onedrive), so that we can run it at our end, understand the issue better and help you out?
—
Vishwas R
Team CanvasJSThe forum is our primary channel for free support. Chat support is on best effort basis.
Having said that, I see that we had responded to your chat multiple times. There were two chat messages when our team was offline and we had reverted with the solution via email on the same day.
Feel free to let us know if you have any further queries.
—
Vishwas R
Team CanvasJSThe code that you have shared seems to be working fine, please take a look at this JSFiddle.
If you are still facing issue, kindly share us the static HTML file along with dependencies(ipl.js) over Google-Drive / Onedrive so that we can run your it locally at our end, understand the scenario better and help you resolve.
—
Vishwas R
Team CanvasJSThanks for sharing the code. We are unable to reproduce the issue you are facing as we don’t have the database sample shared with us. Can you kindly share JSP page and sample database over Google-Drive or Onedrive, so that we can run it locally, understand the issue you are facing and help you resolve it? It would be helpful for us to setup the project locally and run it, if you could export the project as .war / archive along with sample database and share it with us.
—
Vishwas R
Team CanvasJSEarlier WebKit allowed 448MB of canvas buffer memory whereas now they have dropped it to 224MB. Because of this, there was some memory issue with CanvasJS Charts in the latest iOS. However, we have optimized memory consumption in CanvasJS v2.3 – please check out this release blog for more info. Kindly download the latest version of CanvasJS Charts from our download page and let us know your feedback.
We are closing this thread as this is duplicate of Canvas line Chart not Visible IPAD. Please check / revert back in the other thread.
—
Vishwas R
Team CanvasJSIn the code that you have shared, the JSON-format(data and value) doesn’t seems to be proper. Storing names as array of string and values as array of numbers should work fine in this case. Please find the code-snippet for parsing JSON data below.
for(var j = 0; j < probForObj["data"].length; j++){
  dataPoints.push({label: probForObj["data"][j], y: Math.round(probForObj["value"][j])});
}
Please take a look at this JSFiddle for working sample.

—
Vishwas R
Team CanvasJSIf I have CanvasJS Chart License and I want to use my company logo(our customizing logo) on CanvasJS Chart, Is there any support to do it?
You can overlay images on top of chart, please take a look at documentation on Position Image Over Chart for step-by-step tutorial on the same.
And to remove ‘Trial Version’ and ‘CanvasJS’ Credit Link, need Commercial Version of CanvasJS, Right?
Commercial version of CanvasJS doesn’t contain any ‘Trial Version’ or ‘CanvasJS’ credit link. You can download commercial version of CanvasJS from My Account page, once the license is purchased.
—
Vishwas R
Team CanvasJSSetting xValueType to ‘dateTime’ should work fine in your case, as you are passing timestamp as x-value. If this doesn’t solve your issue, kindly create a sample project and share it with us via Google-Drive or Onedrive so that we can look into the code, understand it better and help you out?
—
Vishwas R
Team CanvasJSvalueFormatString defines how values must be formatted before they appear on Axis X. Changing
ValueFormatStringtovalueFormatStringshould work fine in your case.—
Vishwas R
Team CanvasJS@xps,
An HTML document can only have one html tag and one body tag. To display multiple charts in a page, you can have multiple chart-containers (div in this case) and have just one script-tag where you create both chart1 and chart2 and render them. Please take a look at this tutorial on Rendering Multiple Charts in a Page.
Also please take a look at tutorial on HTML and this stackoverflow thread for more info.
—
Vishwas R
Team CanvasJSVariable S and A gets value and goes to global scope inside updateChart method, which gets executed after 10ms (based on the value of updateInterval). But you are consoling the values is outside the method – which gets executed first. Consoling S and A after the first execution of updateChart method should work fine in this case.
Example:
var updateChart = function () {
    S = 35;
    A = Math.sin(Xa * Math.PI / 180);
}
setInterval(function(){
    updateChart();
    consoleValues();
}, 1000);

function consoleValues(){
  console.log(S); //Still accessible outside updateChart method
  console.log(A);
}
—
Vishwas R
Team CanvasJSJens,
Yes, it’s possible to style subtitle by changing fontColor, fontSize, fontFamily, backgroundColor, margin, padding and other available properties. Please take a look at documentation on subtitles for complete list of available customization options.
—
Vishwas R
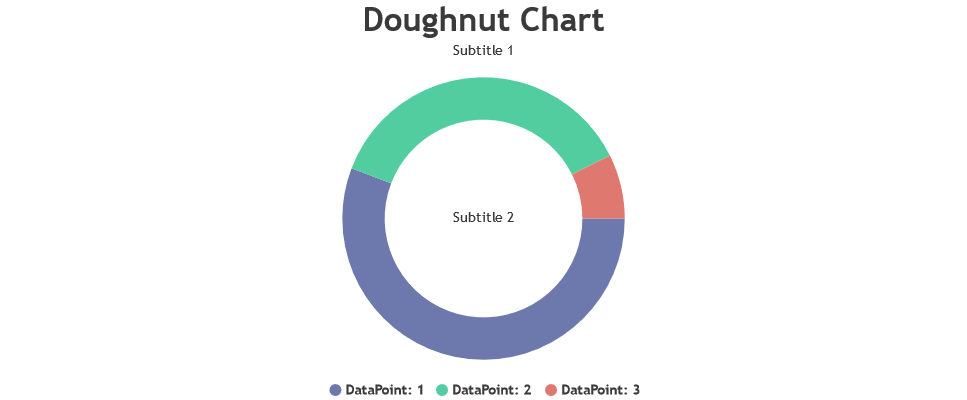
Team CanvasJSAs suggested by @shashiranjan, title & subtitle can be positioned in the center of the pie/doughnut by setting dockInsidePlotArea and verticalAlign properties.
As your requirement includes having a title to the top of the chart, you can use subtitles to be positioned at the center of the chart ( You can add as many subtitles as you want to a chart – so even if you like to have a subtitle at the top of the chart, you can still add another subtitle at the center of the chart). Please find the code-snippet for the same below.
title: {
    text: "Doughnut Chart"
},
subtitles: [{
    text: "Subtitle 1"
}, {
    text: "Subtitle 2",
    verticalAlign: "center",
    dockInsidePlotArea: true
}],
Please take a look at this updated JSFiddle for complete code.

—
Vishwas R
Team CanvasJS