Login to Ask a Question or Reply
You must be logged in to post your query.
Home › Forums › Chart Support › How to Re render with animation
How to Re render with animation
- This topic has 9 replies, 5 voices, and was last updated 7 years, 5 months ago by
guilhermemaranhao.
Tagged: animation, dynamicDatapoints, stackedColumn
-
March 12, 2017 at 11:18 am #14553
Hi
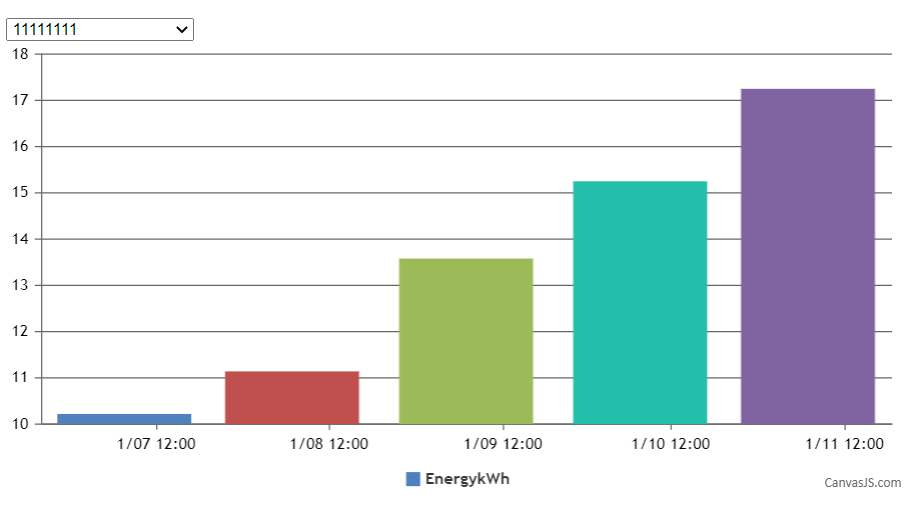
I’m updating dataPoints dynamically based on some dropdown, When I do that animation is not coming. How do I re render with animation?March 13, 2017 at 11:38 am #14558To render the chart each time with animation, you will need to create a new chart with updated options based on the value selected from dropdown. Code snippet below shows how you can achieve the same:
$( ".dropdown" ).change(function() {
  options.data[0].dataPoints = [];
  var e = document.getElementById("dropdownMenu");
  var selected = e.options[e.selectedIndex].value;
  dps = jsonData[selected];
  for(var i in dps) {
    var xVal = dps[i].x;
    options.data[0].dataPoints.push({x: new Date(xVal), y: dps[i].y});
  }
  (new CanvasJS.Chart("chartContainer", options)).render();
});
Please take a look at this JSFiddle for a working example with sample code.
—-
Bivek Singh-
This reply was modified 9 years, 4 months ago by
Bivek Singh.
January 29, 2019 at 7:45 am #24139Hi @bivek,
I instantiate my chart before populating my datapoints, which are set after an ajax request.
At that moment, I render the chart instance and then set the dataPoints.
Even in the first moment, the chart isn’t being loaded in animation mode. The animationEnabled option is set to true.
I did it only if I instantiate the chart after setting the datapoints to an option object and instante (and render) the respective chart. Is that still the only possibility to have the animation working?Thanks, Guilherme
January 29, 2019 at 8:53 pm #24150Can you kindly create a JSFiddle reproducing the issue you are facing and share it with us along with the sample data so that we can look into the code and chart-options being used by you to understand the scenario better and help you out?
From what we have observed, sometimes things get delayed mostly when we are not able to reproduce the issue or not able to understand the exact requirements or the solution that we provide may not work properly due to the variation in chart-options being used by you and us.
Having a JSFiddle helps us in figuring out the issue and suggesting an appropriate solution accordingly.
____
Shashi Ranjan
Team CanvasJSJanuary 29, 2019 at 11:56 pm #24154Hello @shashiranjan!
That’s what I have implemented:
jsfiddle today (not working)That’s how it works (I need to have my dataPoints set before rendering):
jsfiddle (that works)This is what I’d like to do. Set animationEnabled after the dataPoints. I thought it’d work because after the addTo method, the chart is rendered.
jsfiddle (why does not work?)
Why this animated mode does not work? Can’t I simply render the chart again? the only way is instantiating another chart with the dataPoints already set?Thank you,
Guilherme
-
This reply was modified 7 years, 5 months ago by
January 30, 2019 at 6:08 pm #24169Guilherme,
Chart animates only on the first render, as of now. When you use set method, chart re-renders based on the 3rd parameter. During the first render, as there are no dataPoints present, animation wouldn’t be visible. During second render (happened because of set method) animation wouldn’t happen.
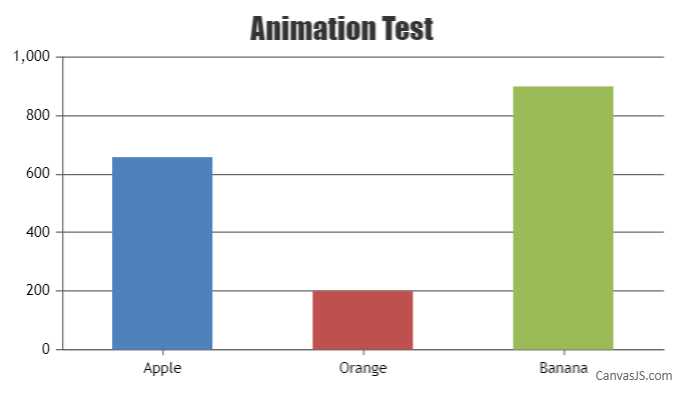
To update dataPoints dynamically and to animate chart, you can instantiate the chart, update dataPoints via chart-options and then call chart.render as shown in the code snippet below:
var chart = new CanvasJS.Chart("chartContainer", {
  title: {
    text: "Animation Test"
  },
  animationEnabled: true,
  data: [{
    type: "column",
    dataPoints: []
  }]
});

chart.options.data[0].dataPoints =  [{ label: "Apple", y: 658 },
                                     { label: "Orange", y: 200 },
                                     { label: "Banana", y: 900 }];
chart.render();
Please take a look at this updated JSFiddle for an example with sample code.
—
Vishwas R
Team CanvasJSJanuary 30, 2019 at 6:14 pm #24172Thank you, @vishwas! That’s exactly what I was looking for, a way to have the animated rendering without having to re-instantiate the chart.
Best regards,
Guilherme
-
This reply was modified 9 years, 4 months ago by
Tagged: animation, dynamicDatapoints, stackedColumn
You must be logged in to reply to this topic.