Login to Ask a Question or Reply
Forum Replies Created by Vishwas R
-
Max Fey,
Adding
commonjsOptions: { transformMixedEsModules: true }to the build option of Vite config should fix this issue. Please refer to this Stack Overflow thread for more information about the same. Please take a look at this link for a working sample that’s deployed in vercel and checkout this Github repository for the project.—
Vishwas R
Team CanvasJSMax Fey,
We tried deploying a React app with CanvasJS Chart in vercel, it seems to be working fine. Please take a look at this link for a working sample that’s deployed in vercel and checkout this Github repository for the project.
If you are still facing issue, kindly share your project with us over Google-Drive or Onedrive (or in Github) so that we can try deploying it from our side to understand the scenario better and help you out.
—
Vishwas R
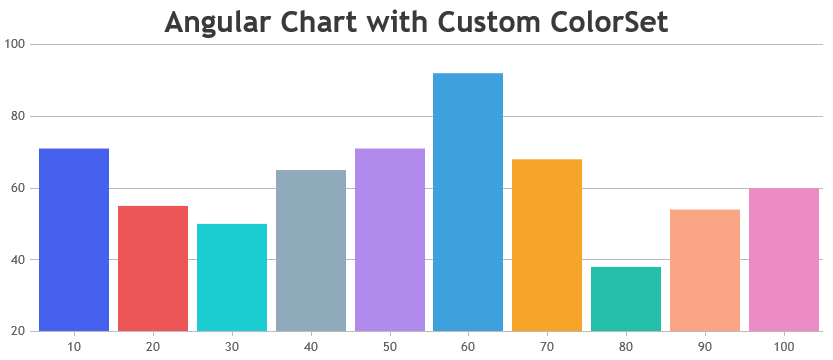
Team CanvasJSMarch 28, 2024 at 6:15 pm in reply to: How to define your own color set for a ReactJS canvas component? #44863You can import CanvasJS from angular-charts package to add custom colorset as shown in the code-snippet below.
import { CanvasJS } from '@canvasjs/angular-charts';
CanvasJS.addColorSet('customColorSet', ['#4661EE', '#EC5657', '#1BCDD1', '#8FAABB', '#B08BEB', '#3EA0DD', '#F5A52A', '#23BFAA', '#FAA586', '#EB8CC6']);
Please take a look at this Stackblitz for an example of the same.
—
Vishwas R
Team CanvasJSLabels are displayed at regular intervals on the axis. Additionally, to enhance readability and prevent overlapping, the chart omits alternate labels, in some cases. However, if you prefer to display all labels, you can achieve this by setting the interval to 1.
axisX: {
  interval: 1
}
Please take a look at this updated JSFiddle for the working code.
—
Vishwas R
Team CanvasJSBounds of axis depends on multiple factors including the axis labels. In your case, ticks of axisY & axisY2 are not getting aligned as labels are shown for axisY, which takes up space towards the top of the axis & axisY2 doesn’t. You can overcome this either by reducing labelFontSize in axisY or by setting labelFontColor of axisY2 to be same as chart-background along with a negative margin. Please take a look at this updated JSFiddle for an example where ticks are aligning.
—
Vishwas R
Team CanvasJSWe tried deploying the production build in a server and in vercel, it seems to work fine when you mention chart component to be used in client-side (
"use-client"). Please take a look at this link for a working sample that’s deployed in vercel and checkout this Github repository for the project.If you are still facing issue, kindly share your project with us over Google-Drive or Onedrive (or in Github) so that we can try deploying it from our side to understand the scenario better and help you out.
—
Vishwas R
Team CanvasJSCanvasJS is a client-side library and has to be prevented from rendering at server-side. When you try to generate build for production, it causes issue with libraries that depend on the browser’s window object. You can import CanvasJS package dynamically by passing
ssr: falsethat disables importing of components that are not needed for SSR. Please take a look at this sample project for a working example on adding CanvasJS React Charts in Next.js app.
Also, please refer to this article for more information on adding CanvasJS chart in Next.js apps.
—
Vishwas R
Team CanvasJSJanuary 8, 2024 at 10:58 am in reply to: Chart is cutted off at start when only axisY2 is in use #44433The solution to show the label 40 depends on multiple factors based on chart-options you are using. Setting axisX viewportMinimum to a 38/39 or setting labelAngle to a positive value should work. However, these are not the limited set of solutions as we don’t know the exact use-case of yours. Kindly try out the solutions & see if it works. If you are still facing issue, kindly create a JSFiddle reproducing the issue (with sample data) & share it with us so that we can look into the chart-options being used, understand the scenario better and help you out.
—
Vishwas R
Team CanvasJSIt’s not possible to align multi-series box and whisker chart side-by-side as of now, similar to column chart. However, you can increase / decrease x-values of datapoints to achieve the same. Please take a look at this updated JSFiddle for an example on the same.
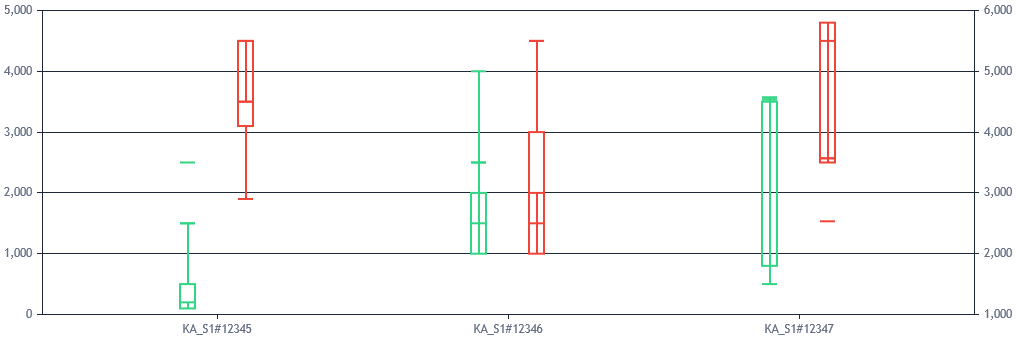
—
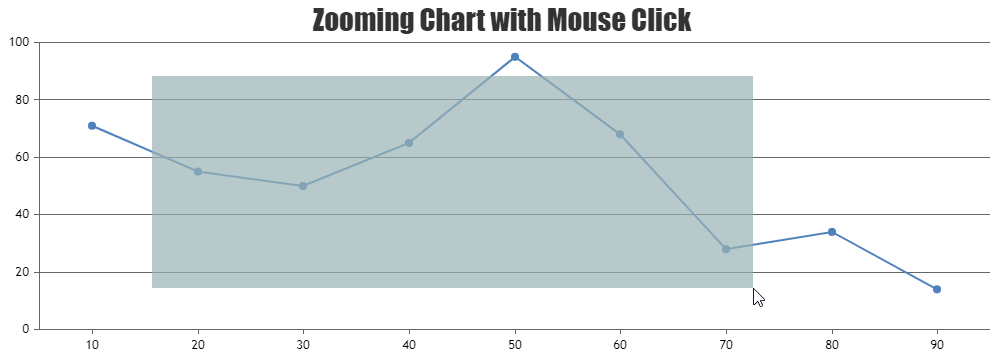
Vishwas R
Team CanvasJSZooming into a region by selecting region based on taps is not available as an inbuilt feature as of now. However, you can achieve the same with few lines of code by changing the viewport based on the clicks / taps. Please take a look at this JSFiddle for an example on the same.
—
Vishwas R
Team CanvasJSYou can place an icon (info or question-mark) to the top-right of the chart & pass description as title attribute of the icon. The description will be shown in a tooltip on hovering the icon. Please take a look at this JSFiddle for an example.
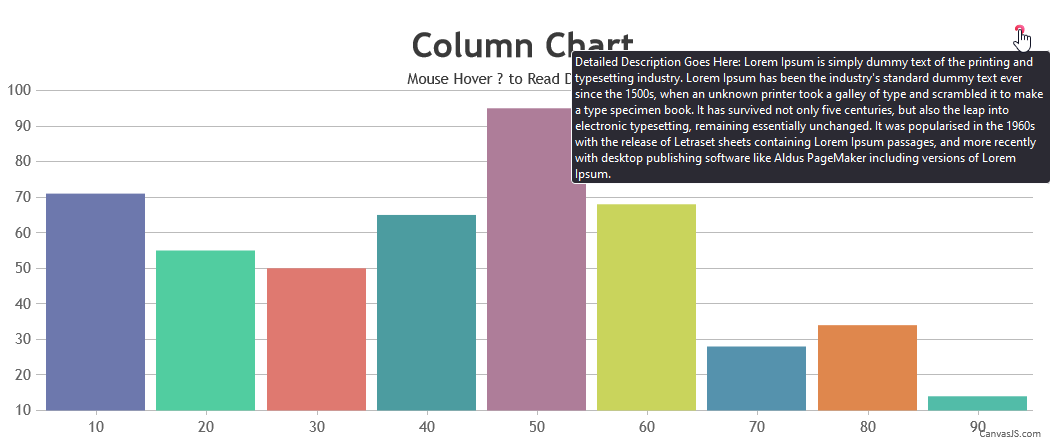
Also, you can convert it to a JavaScript function so that you can add information for multiple charts. Please refer to this JSFiddle for an example on the same.
—
Vishwas R
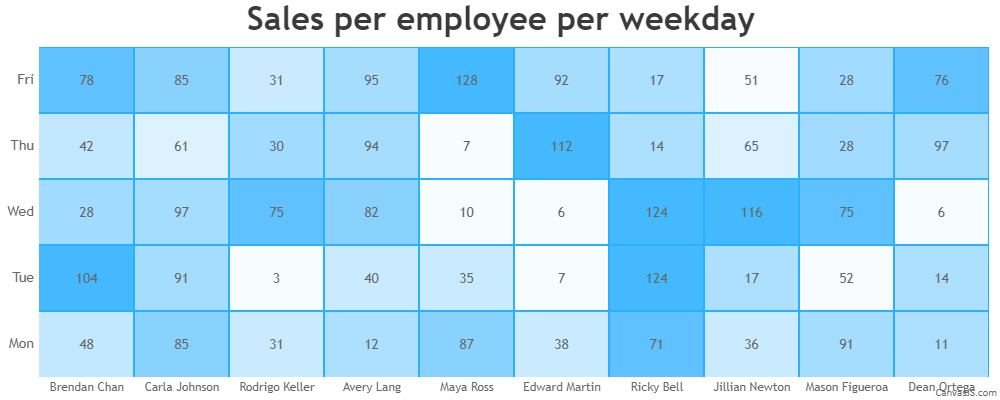
Team CanvasJSHeatmap is not available as of now. However, you can achieve heatmap using Stacked Column 100% chart as shown in this JSFiddle.
—
Vishwas R
Team CanvasJSUsing date-time values in x-value seems to be working fine. Please take a look at this documentation page for examples on the same. If you are still facing issue, kindly create JSFiddle reproducing the issue you are facing and share it with us so that we can look into the code/chart-options being used, understand the scenario better and help you out.
—
Vishwas R
Team CanvasJS