Login to Ask a Question or Reply
You must be logged in to post your query.
Home › Forums › Chart Support › Grouped bar chart(stacked Column), gap between the bars, index Label, legends
Grouped bar chart(stacked Column), gap between the bars, index Label, legends
- This topic has 6 replies, 4 voices, and was last updated 3 years, 7 months ago by
mm.
Tagged: indexlabel, legends, space
-
June 22, 2021 at 5:24 pm #34698
Hi Team,
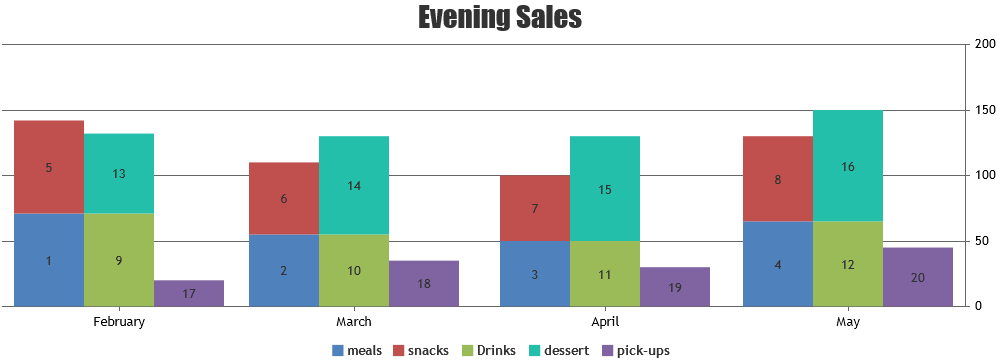
1. Am trying to create a grouped bar chart (stackedColumn), where i have gap between each dataPoint, but in each dataPoint i have 3 bars without gap, is it possible to provide space between each bar in dataPoint ?
2. Am giving indexLabel for each point in dataPoints, But its getting overlapped on same indexLabel. is it possible to give indexLabel for each point in dataPoints ?
In the JSFiddle i have shared my code, https://jsfiddle.net/1f0wLysj/
3. Legends:
In the link i have shared, below are the legends am displaying
blue – meals
red – snacks …
But, in my case:
First dataPoint blue tends to meals_1, red tends to snacks_1
Second dataPoint blue tends to meals_2, red tends to snacks_2
What is the best way to display legends for the above requirement ?June 23, 2021 at 9:32 am #34705Hi Team,
Sorry, below is the Link for the Code
https://jsfiddle.net/1f0wLysj/Thanks in Advance
June 23, 2021 at 6:55 pm #347071. Am trying to create a grouped bar chart (stackedColumn), where i have gap between each dataPoint, but in each dataPoint i have 3 bars without gap, is it possible to provide space between each bar in dataPoint ?
Sorry, it is not possible to add gaps between dataPoints in multiseries column chart as of now.
2. Am giving indexLabel for each point in dataPoints, But its getting overlapped on same indexLabel. is it possible to give indexLabel for each point in dataPoints ?
In the JSFiddle i have shared my code, https://jsfiddle.net/1f0wLysj/
Based on the example shared, the axisYType property has been assigned to values “first” and “third”. Whereas, it can only be set to “primary” or “secondary”. Currently on setting the acceptable values to axisYType, the indexLabel are center aligning between the dataPoints which is a known bug and we would be fixing in future versions.
If you are trying to assign each dataSeries to a specific y-axis you can set axisYIndex property to the index of the y-axis the dataSeries should be attached to.
3. Legends:
In the link i have shared, below are the legends am displaying
blue – meals
red – snacks …
But, in my case:
First dataPoint blue tends to meals_1, red tends to snacks_1
Second dataPoint blue tends to meals_2, red tends to snacks_2
What is the best way to display legends for the above requirement ?Legends are assigned to individual dataSeries and not to each dataPoints for column charts as of now.
___________
Indranil Deo
Team CanvasJSNovember 8, 2022 at 1:03 pm #39507Hello,
the indexLabel are center aligning between the dataPoints which is a known bug and we would be fixing in future versions.
I just stumbled upon this issue as well. Do you have a plan when this is going to be fixed?
November 11, 2022 at 9:27 am #39530@mm,
Sorry for the inconvenience caused. We will fix it in our upcoming versions and we will keep you posted once the bug is fixed.
—
Vishwas R
Team CanvasJSNovember 21, 2022 at 10:56 am #40000[UPDATE]
@mm,We have just released CanvasJS Charts v3.7.2 with this fix. Please refer to the release blog for more information. Do download the latest version from our download page and let us know your feedback.
—
Vishwas R
Team CanvasJSNovember 29, 2022 at 4:24 pm #40136
Tagged: indexlabel, legends, space
You must be logged in to reply to this topic.