Login to Ask a Question or Reply
Forum Replies Created by Suyash Singh
-
As of now indexLabels support only strings. However if you are trying to make indexLabels bolder, you can use indexLabelFontWeight property.
__
Suyash Singh
Team CanvasJSThis can be achieved using axis scale breaks, which is on our roadmap and will be released in future versions.
—
Suyash Singh
Team CanvasJSKristoffer,
Please refer this page for info on intervalType. Can you kindly create a working jsfiddle, so that we can understand the code better and help you out resolving the issue.
__
Suyash Singh
Team CanvasJSKristoffer,
You can achieve this using interval and intervalType.
__
Suyash Singh
Team CanvasJSSteve,
Gantt chart is in our roadmap, but no timeline has been fixed for it as of now.
__
Suyash Singh
Team CanvasJSSteve,
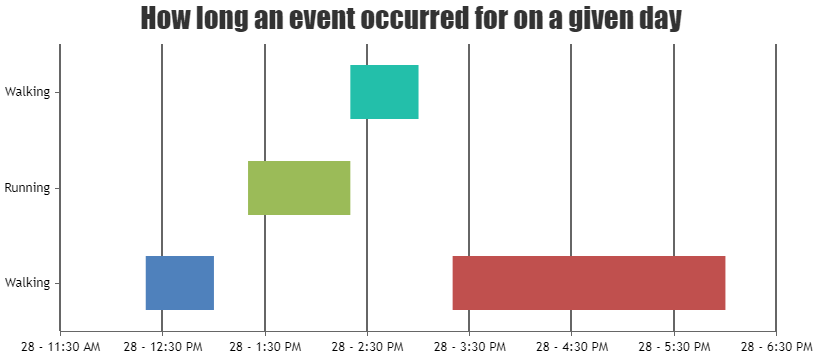
It is not possible to assign dateTime values as the y value in dataPoints, therefore it is not possible to create a Gantt Chart which contains dateTime values on the y-axis. But as a workaround, it is possible to use rangeBar chart and provide timestamp values as y-values and use CanvasJS.formatDate() in labelFormatter to convert the labels which is in timeStamp values into dateTime values. You can use the same logic in contentFormatter property as well to show the dateTime values in toolTip.
Please take a look at this code snippet below,
  axisY: {
    minimum: (new Date(2016, 0, 28, 12, 0)).getTime(),
    interval: (1 * 60 * 60 * 1000),
    labelFormatter: function(e){
      return CanvasJS.formatDate(e.value, "DD - h:mm TT");
    },
    gridThickness: 2
  },

  toolTip:{
    contentFormatter: function ( e ) {
      return "<strong>" + e.entries[0].dataPoint.label + "</strong></br> Start: " +  CanvasJS.formatDate(e.entries[0].dataPoint.y[0], "DD - h:mm TT") + "</br>End : " +  CanvasJS.formatDate(e.entries[0].dataPoint.y[1], "DD - h:mm TT");
    }}
Also, kindly take a look at this JSFiddle for the complete code as an example on creating a workaround Gantt Chart using CanvasJS.formatDate method.

—
Suyash Singh
Team CanvasJSinterval and intervalType properties will work irrespective of the chart type – static or dynamic.
axisX: {
    inteval: 4, // interval
    intervalType: "second"
  },
There is a typo in your code. Please change
intevaltointervaland it should work fine.__
Suyash Singh
Team CanvasJSUpdating legend text dynamically seems to be working fine. Please take a look at this updated JSFiddle.
If you are still facing issue, can you kindly create a JSFiddle reproducing the issue you are facing and share it with us so that we can understand the scenario better and help you out?
__
Suyash Singh
Team CanvasJS