You must be logged in to post your query.
Home › Forums › Report Bugs › Line Graph Point Connection Bug
Tagged: bug, connection, Line, points
Thank you very much @Suyash Singh and @vishwas R, now my chart is running perfect. Soon I will share you the last result but now thanks so much with this issue. Best regards!
Hi again!!,All is working good for my ECG chart thank you for your help. Now I´m trying to show the information that I have in the chart for example : 
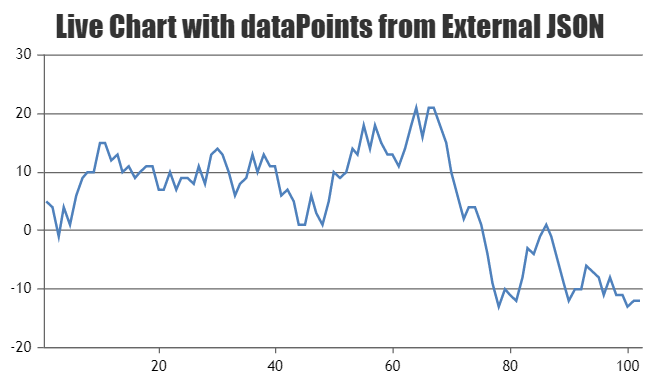
but I can´t do it well I have the next result: I have the date in a long format and my requirement is like the example. I share you the code that I use to try to do it : jsfiddle Best regards!!
@saul_romero,
The legendText was showing NaN because the JSON you were using didn’t had valuey in the last object. {"valuex":"2017-02-20 17:44:36"} Also the legendText had a redundant 0 in front of it, because value (a number) was concatenated to a string deltaX. value = value + deltaX; You will need to initialize value as an empty string. To format the the legend text you can use CanvasJS.formatDate() with "YYYY-MM-DD hh:mm:ss:fff" valueFormatString. Please check this updated JSFiddle.
valuey
{"valuex":"2017-02-20 17:44:36"}
value
deltaX
value = value + deltaX;
"YYYY-MM-DD hh:mm:ss:fff"
__
Suyash Singh Team CanvasJS
Thanks @Suyash singh, My chart have the correct format but now my chart is static doesn’t accept new data, I´m using the same code so this function should works, I fixed that deleting the next code: ` dataLength = result.length;sortDataPoints(data, ‘x’);value = value + deltaX; value2 = value2 + deltaY;valor = CanvasJS.formatDate(new Date(value), “YYYY-MM-DD hh:mm:ss:fff”) + ” HR :”+ value2 + ” 25mm/s 10mm/mv”;chart.options.data[0].legendText = valor; But how you suppose it’s necessary to show the legend text with the values coming, If you know how I can do this works again I will be very grateful.
You are getting a static chart because the JSON provided is static. For making the chart dynamic please have a look at this tutorial on creating live Updating Charts from JSON.
—
Thanks for the tutorial @suyash Singh but my Json is dynamic here is an Example I load data from my database but when I add the code for the legend text this not load nothing.
Updating legend text dynamically seems to be working fine. Please take a look at this updated JSFiddle.
If you are still facing issue, can you kindly create a JSFiddle reproducing the issue you are facing and share it with us so that we can understand the scenario better and help you out?
__ Suyash Singh Team CanvasJS
You must be logged in to reply to this topic. Login/Register