Login to Ask a Question or Reply
Forum Replies Created by Suyash Singh
-
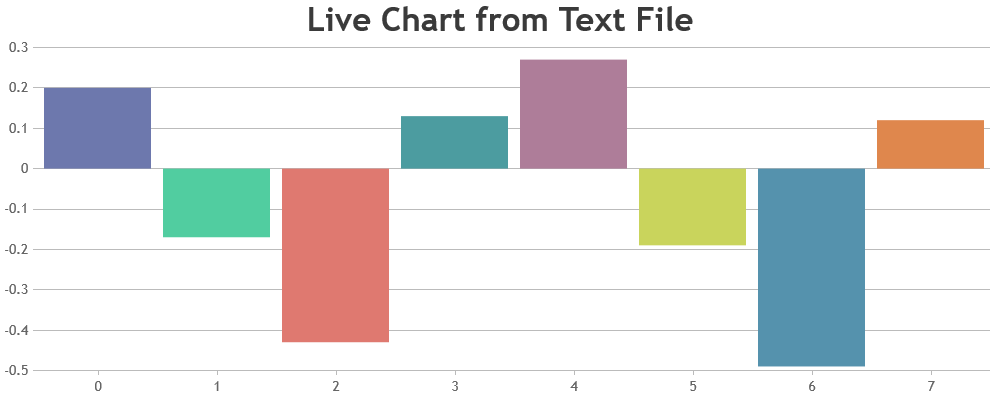
Please refer to this forum thread for more info & example on creating chart with data from a text file.

___
Suyash Singh
Team CanvasJSThank you for letting us know about the workaround.
As far as the drill down is considered, the approach might work fine. However, you need to take into account the fact that toolTip might pop up and fire event even when the mouse moves out of the filled area of the stackedArea chart.
___
Suyash Singh
Team CanvasJSWe are looking into it and will get back to you at the earliest.
___
Suyash Singh
Team CanvasJSYou can do so by placing any HTML element (div, button etc.) in the toolTip content and attaching click event handler to it. Please, have a look at this jsfiddle.
___
Suyash Singh
Team CanvasJSThis forum is for technical queries only. Please, contact sales[at]canvasjs.com for license related queries.
___
Suyash Singh
Team CanvasJSCan you please create a jsfiddle reproducing the the issue that you are facing so that we can look into your code and help you out better.
___
Suyash Singh
Team CanvasJS@wep,
You can specify the minimum and maximum permitted values by setting minimum and maximum property of axisY to 0 and 100 respectively.
If this is not what you are looking for can you please create a jsfiddle so that we can look into your code and help you out better.
___
Suyash Singh
Team CanvasJSOmkar Patil,
Sorry, we are unable to reproduce the issue on our end. Can you kindly create a jsfiddle reproducing the same so that we can look into your code and help you out better?
___
Suyash Singh
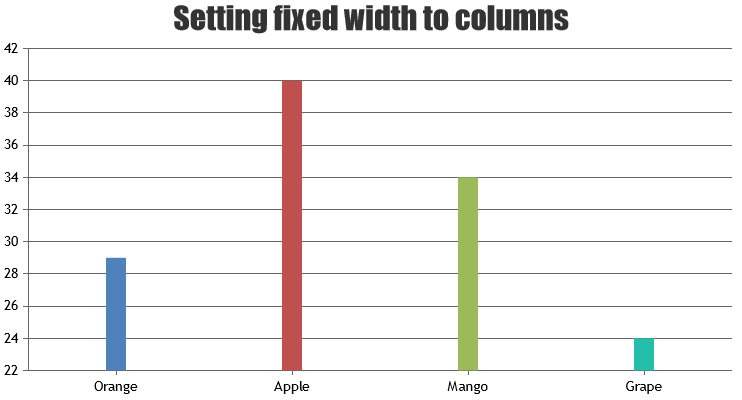
Team CanvasJSYou can set the width of the bars using the dataPointWidth property.

We observed that you are usingmin-widthfor setting the height which prevents the the height of the div getting lower than 360px in your case but it is not an absolute value. It would be better if you could follow something like :
<div id="chartContainer" style="height: 360px; width: 100%;"></div>The label text clips only when the text is very long. If you are still facing some issue, can you please create a jsfiddle reproducing the label clipping?
Also kindly elaborate what do you mean by total graph width.
___
Suyash Singh
Team CanvasJSYou can set the width of the bars using the dataPointWidth property. We observed that you are using
min-widthfor setting the height which prevents the the height of the div getting lower than 360px in your case but it is not an absolute value. It would be better if you could follow something like :<div id="chartContainer" style="height: 360px; width: 100%;"></div>The label text clips only when the text is very long. If you are still facing some issue, can you please create a jsfiddle reproducing the label clipping?
Also kindly elaborate what do you mean by total graph width.
___
Suyash Singh
Team CanvasJSWe are working on it and will get back to you at the earliest.
___
Suyash Singh
Team CanvasJS