Login to Ask a Question or Reply
Forum Replies Created by Suyash Singh
-
Cristian,
As of now, we don’t have minimum and maximum property for controlling the bubble size. However, you can control the same using z value.
You can also go with scatter chart along with markerSize if it suits your requirements.
___
Suyash Singh
Team CanvasJS-
This reply was modified 8 years, 9 months ago by
Suyash Singh.
Please have a look at viewPortMinimum, viewPortMaximum, minimum, maximum.
Also you can go through rangeChanged and rangeChanging events which are triggered after/before viewportMinimum or viewPortMaximum are updated while zooming, panning, or reset.
___
Suyash Singh
Team CanvasJSIt seems like you are not calling the render method on the chart. If this is not your case, can you please create a jsfiddle reproducing the issue, so that we can look into it and help you out better?
___
Suyash Singh
Team CanvasJSWhen you set date-time values to “x” it is not possible to skip weekends and holidays. Axis behaves linearly across the date range.
In cases where you want to show only working days, then its better to use “label” instead of “x”. But it requires you to format the date/time into required string format before assigning. You can use the formatDate() to do the same. Here is a page on label.
___
Suyash Singh
Team CanvasJSCristian,
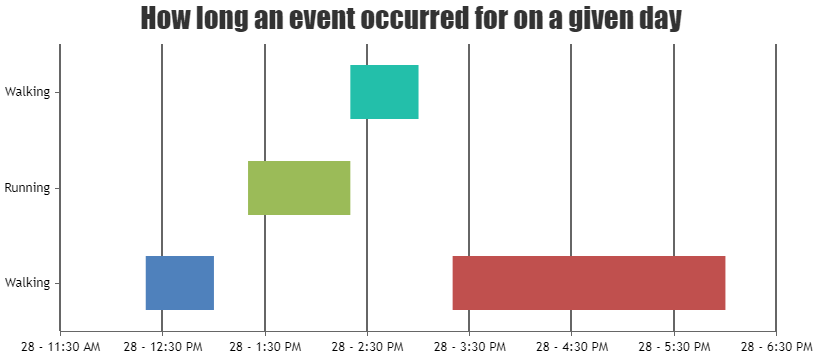
You can display multiple intervals for same label by using x values in the dataPoints. Please have a look at this updated jsfiddle.

___
Suyash Singh
Team CanvasJSIt was a bug in v1.7 and it has been fixed. Kindly download the latest version (v1.9.8) and let us know your feedback.
—
Suyash Singh
Team CanvasJSCristian,
You can achieve this by adding null dataPoints in the stepLine chart, as shown in this example.
___
Suyash Singh
Team CanvasJSCristian,
axisY doesn’t support datetime values as of now. However, you can workaround by converting dateTime to timestamp and formatting y-axis labels using labelFormatter. Please take a look at this JSFiddle for an example on creating timeline chart with the help of Range Bar chart.
___
Suyash Singh
Team CanvasJSWe are unable to reproduce the issue on our end. Can you please create a jsfiddle reproducing the issue so that we can look into it and help you out better?
___
Suyash Singh
Team CanvasJSHi @kingbib,
processData(allText)requires an argument. Since you are not passing any argument to it,setInterval(function(){ processData(); }, 1000);an error is thrown when you try to split the variable allText since it is undefined.Instead of calling the processData() only, you can put the entire ajax call in setInterval.
setInterval(function(){
    $.ajax({
        type: "GET",
        url: "dataSmall.txt",
        dataType: "text",
        success: function (data) { processData(data); }
    });
 }, 1000);
This will resolve your issue.
___
Suyash Singh
Team CanvasJS@fbk,
For security reasons, browsers restrict cross-origin requests. The text and the html files both have to be on the same server. You can set up a local server if you want to read the file directly.
Please refer stackOverflow for more information.
___
Suyash Singh
Team CanvasJS@kingbub,
It would be better if you create the chart once, update the dataPoints and render it again on every update.
Also you can use setInterval to update the chart after a fixed interval.
Please check the uploaded zip file.___
Suyash Singh
Team CanvasJSCan you please brief us more about the source of your text file and the data format you are using to store data?
___
Suyash Singh
Team CanvasJS -
This reply was modified 8 years, 9 months ago by