Login to Ask a Question or Reply
Forum Replies Created by Sunil Urs
-
You can access it via jQuery like this.
$(“#chartContainer .canvasjs-chart-canvas”).first()
If you need the dom element instead of jQuery object, you can use get method of jQuery
$(“#chartContainer1 .canvasjs-chart-canvas”).get(0)
—
Sunil UrsYes, its the same email id which you have on your profile. jvillema[XX]@[company domain]. I’ve resent the email. Please check your spam box too.
You can do so by setting the interval to a desired value.
—
Sunil UrsAsis,
Sorry, custom formatting of labels is not available as of now.
—
Sunil UrsYKB,
This feature is not available as of now.
—
Sunil UrsJust sent the latest build over email.
—
Sunil UrsMeuhmeuh,
Range area chart is coming in the next version – v1.5. I fact I’ve already implemented it. Need to complete few more features before I can release the same. In case you are fine with an early build, shoot me an email at info@canvasjs.com
—
Sunil UrsApril 4, 2014 at 8:48 pm in reply to: How to reset Spline Area graph which is continuously runnig #6152Bharat,
You can reset the chart this way
chart.options.data[0].dataPoints = [];//assign a new array.
chart.render();
—
Sunil Urs[Update]
Now we have a Tutorial on Creating Charts from JSON Data in our documentation.
Matthewpoll,
Here is a JSFiddle that I created.
-
This reply was modified 9 years, 6 months ago by
Sunil Urs.
Peter,
In this version disabling touch is still not available. But I’ve fixed a bug due to which scrolling through page was not possible by dragging on the chart. I’ll be adding option to disable interactivity in the 1.4 GA – by the end of next week.
—
Sunil Urs-
This reply was modified 11 years, 11 months ago by
Peter, I’ve added to our list. But I won’t be able to give a timeline at this point in time.
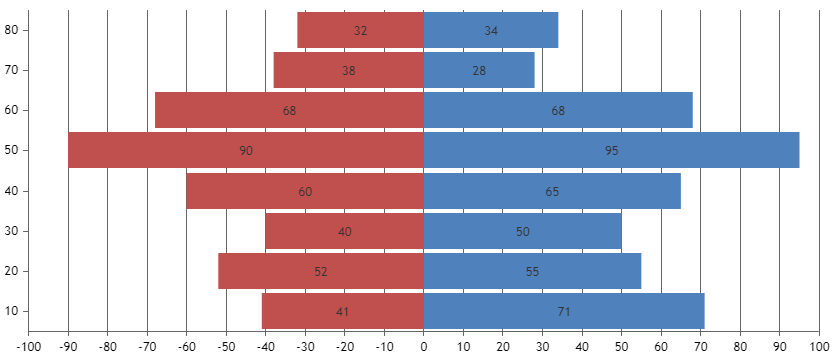
Sorry, that was a typo. I meant to say “you can’t format them to show absolute values”. As a workaround, you can set indexLabel property of each dataPoint to its absolute value and it should work fine as shown in this JSFiddle. But labels on the axis would remain the same.
—-
Sunil Urs
Team CanvasJSThere is no way to handle this case automatically. But you can do that check yourself and set color property of individual dataPoints accordingly.
In case you are not showing legends, you can use them to show any custom message as shown in this example. Just position legend according to the requirement.
Is it possible to format negative value in order to have absolute value ?
Am afraid this is not possible.
And is it possible for indexLabel and label ?
Though you can use xValueFormatString & yValueFormatString to format values inside labels, you can format them to show absolute values.
—-
Sunil Urs
Team CanvasJS -
This reply was modified 9 years, 6 months ago by