Login to Ask a Question or Reply
Forum Replies Created by Sunil Urs
-
Helge,
I’ll look into this issue and get back at the earliest. Thanks for the jsfiddle.
—
Sunil Urseniman,
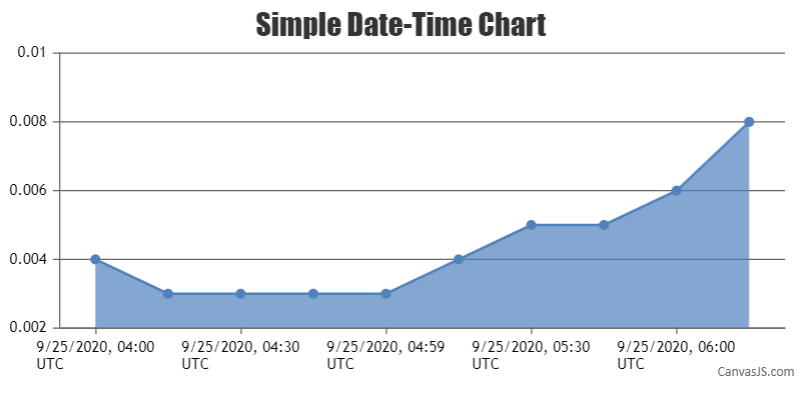
Date / timestamp values should be assigned to x and not to lables. Here you can see it working. If required you can further customize the lables and tooltips using valueFormatString & xValueFormatString properties.
—
Sunil UrsCan you please create a minimal ASP.Net solution that can reproduce the issue so that I can have a look?
—
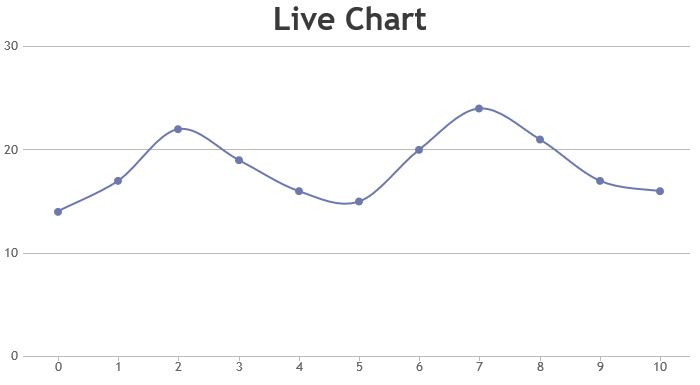
Sunil UrsHere you have already passed the dataPoints value and hence the chart will be rendered with all the dataPoints.
To create a dynamic chart, you will have to create and assign dataPoints to a pre-defined variable (Eg: dps). After which you will have to create a function which adds the next dataPoint and call chart.render(). Then you can call the function at regular intervals which adds the dataPoint and renders the chart.
Please take a look at the code snippet below,var xVal = dps.length + 1; var yVal = 100; var updateInterval = 1000; var updateChart = function () { yVal = yVal + Math.round(5 + Math.random() *(-5-5)); dps.push({x: xVal,y: yVal,}); xVal++; chart.render(); }; setInterval(function(){updateChart()}, updateInterval);Please take a look at this documentation page link for a step-by-step tutorial to create a dynamic chart that updates dataPoints at regular intervals.
Welcome
Daniel,
The issue is that the height is not set for the chart container and hence border is getting drawn only at the top. Here is a JSFiddle with the issue fixed.
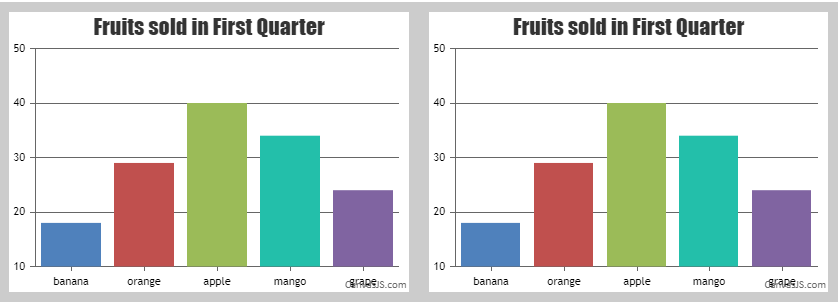
As of now whenever height of the container is not set, we use default size on chart but don’t set height of the container itself. In future versions we’ll consider this.
—
Sunil Urs
Team CanvasJSMay I know your browser & its version please?
@Slejnej: As Daniel mentioned you probably don’t have a latest version on the website. Can you please download the latest version and let me know if its working as expected. If not, can you give me the link to that site?..
dataPoints should be an array. What you are using instead is an object with indexes 0,1,2,etc. Below is how the array should look like.
"dataPoints": [ { "x": 1399766400000, "y": 97.804 }, { "x": 1399852800000, "y": 98.387 }]When checking for undefined, its better to go with below code which works across browsers and devices.
typeof(max) === 'undefined'Daniel,
Makes sense. I’ll consider this for next version.
—
Sunil UrsAs of now only timestamps or date objects can be assigned to x. Other formats are not supported yet.
—
Sunil UrsUsing toDataURL