Login to Ask a Question or Reply
Forum Replies Created by Manoj Mohan
-
Importing ‘@canvasjs/react-stockcharts’ dynamically for client side rendering should resolve the issue happening with the build script as well. Please take a look at the code snippet below for the same.
import dynamic from "next/dynamic";
const CanvasJSStockChart = dynamic(() => import("@canvasjs/react-stockcharts").then((mod) => mod.default.CanvasJSStockChart ), { ssr: false });
Also, check out this updated sample project for complete working code.
—–
Manoj Mohan
Team CanvasJSStockChart seems to be working fine with Next.js. Please take a look at this sample project for integration of CanvasJS StockChart with Next.js.
If you are still facing the issue, kindly create sample project reproducing the issue and share it with us over Google-Drive or Onedrive along with sample data so that we can look into your code, run it locally at our end to understand the scenario better and help you out.

—-
Manoj Mohan
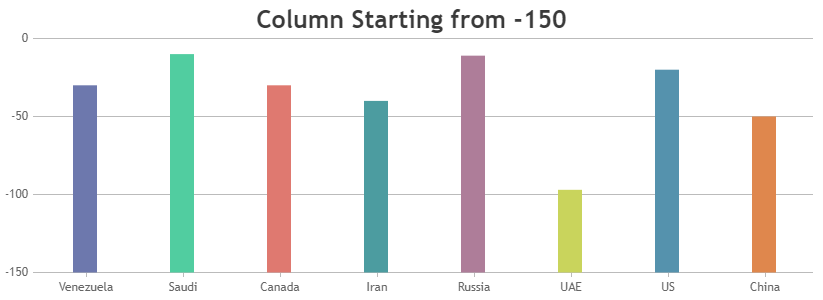
Team CanvasJSDecember 1, 2023 at 6:50 pm in reply to: bars to start from -150 and only extend upward to the specified values. #44293@ajit,
You can use Range Column Chart to show base of the column at -150 by passing the first y values as-150and second value same as your existing y value for column chart. Please take a look at the code snippet for the converting column to rangeColumn and starting column at -150.for(var i=0; i<chart.options.data[0].dataPoints.length; i++) { chart.options.data[0].dataPoints[i].y = [-150, chart.options.data[0].dataPoints[i].y]; } chart.options.data[0].type = "rangeColumn";Also, check out this JSFiddle for complete working code.
—-
Manoj Mohan
Team CanvasJSYou can get access to stockchart object from event parameter of tooltip’s updated event as
e.chart.stockChart. Please take a look at the code snippet below to show the tooltip across charts in stockchart based on nearest x value.function showTooltip(e) { var stockChart = e.chart.stockChart; var charts = stockChart.charts; for( var i = 0; i < charts.length; i++){ if(charts[i] != e.chart) { charts[i].toolTip.showAtX(getNearestXValues(e.entries[0].xValue, charts[i].data[0].dataPoints)); } } } function hideTooltip(e) { var stockChart = e.chart.stockChart; var charts = stockChart.charts; for( var i = 0; i < charts.length; i++){ if(charts[i] != e.chart) charts[i].toolTip.hide(); } }Also, check out this updated JSFiddle for the complete working code.
—-
Manoj Mohan
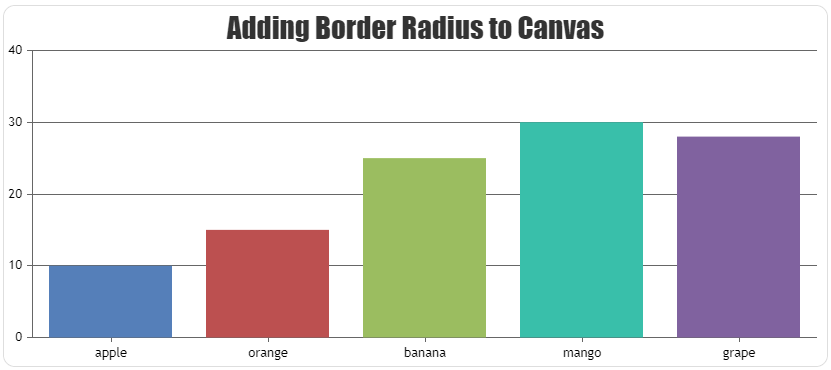
Team CanvasJSAre you looking to add border radius to chart container? If yes, you can add it through CSS as shown in the code-snippet below.
.canvasjs-chart-canvas {
  border-radius: 12px;
}

#chartContainer {
  border: 1px solid #dedede;
  border-radius: 12px;
}
Also, check out this JSFiddle for complete working code.
—-
Manoj Mohan
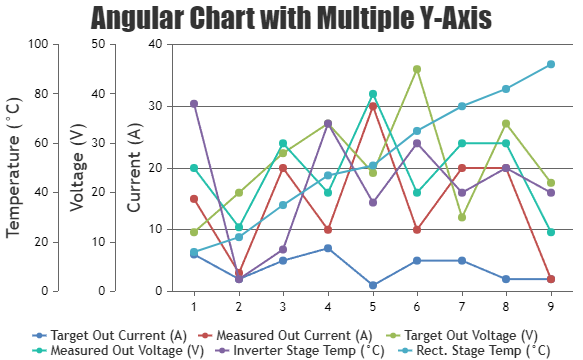
Team CanvasJSNovember 24, 2023 at 8:01 pm in reply to: URGENT : Need integrated solution – with ANGULAR 15 #44246You can create a chart with 3 y-axes for Current, Voltage, and Temperature and use the axisYIndex property to assign each dataseries to a particular y-axis.
Please check this StackBlitz for a working example on the same.
—
Manoj Mohan
Team CanvasJSTo display numbers after decimal point in the axis labels, you can use valueFormatString. Also, if you are looking to format the values in the tooltip, you can use yValueFormatString.
If you are still facing the issue, can you kindly share the pictorial representation of your requirement so that we can understand your scenario better and help you out?
—-
Manoj Mohan
Team CanvasJSCan you kindly brief us more about your requirements, the format in which you would like to show the labels (9.0, 9.2, 9.4,…, 10 or 9, 10, 11,…) so that we can understand your scenario better and help you out?
—-
Manoj Mohan
Team CanvasJSYou can set
valueFormatString: "#0.0"to show 1 decimal value in the axis labels. Please refer to our documentation page for more customization options available.—-
Manoj Mohan
Team CanvasJSThe tooltip of the charts within StockChart are synced based on x-values by default. In order to sync tooltip based on nearest x-values, you can find the nearest x-values and show tooltip on the other charts using showAt method of toolTip. Please take a look at the code snippet below.
function getNearestXValues(xVal, dps1) {

  return [].concat(dps1).sort(function(a, b) {
    var diffA = Math.abs(xVal - a.x);
    var diffB = Math.abs(xVal - b.x);
    return diffA - diffB; // sort a before b when the distance is smaller
  })[0].x;

}

function showTooltip(e) {
  for( var i = 0; i < stockChart.charts.length; i++){
    if(stockChart.charts[i] != e.chart) {
      stockChart.charts[i].toolTip.showAtX(getNearestXValues(e.entries[0].xValue, stockChart.charts[i].data[0].dataPoints));
    }

  }
}
Also, check out this updated JSFiddle for complete working code.

—-
Manoj Mohan
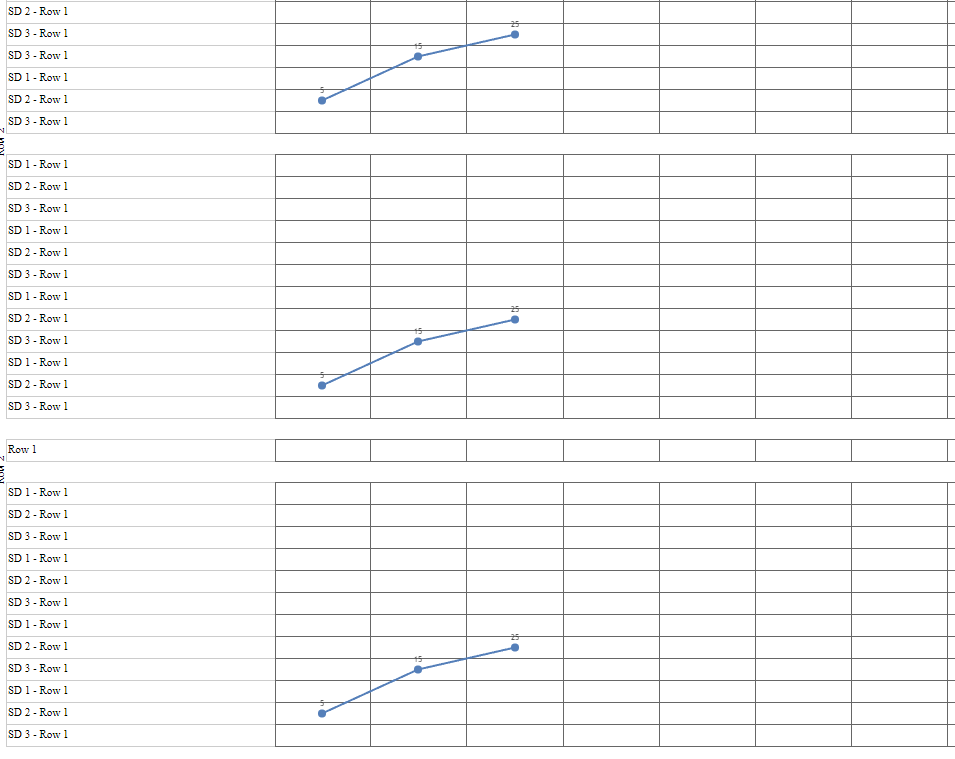
Team CanvasJSIt seem to be working fine, attaching screenshot for your reference.
—–
Manoj Mohan
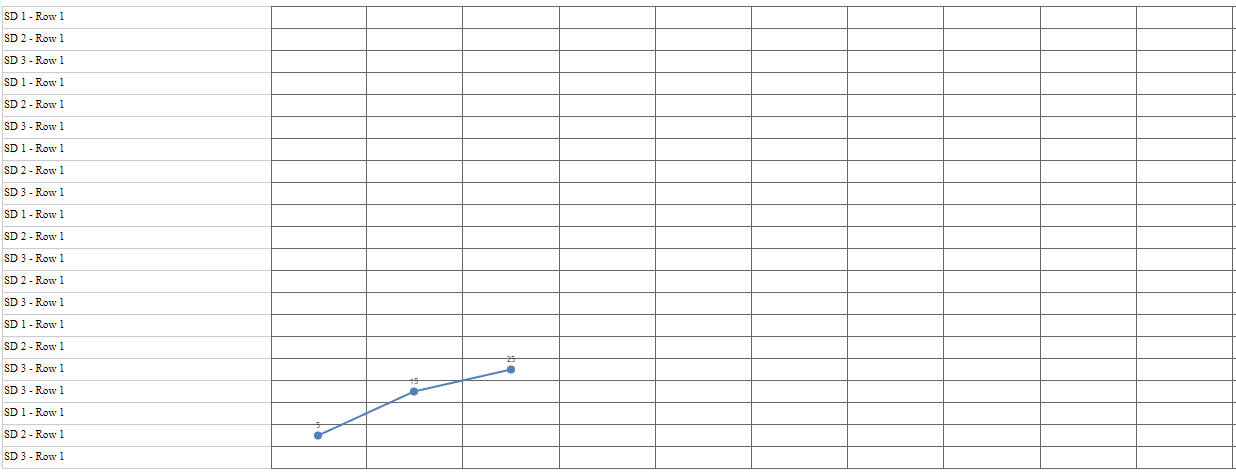
Team CanvasJSSince you are passing border width as 1.5px for the rows, there is some round off issue which results in misalignment with chart gridlines. Passing integer value to border-width and height to row seems to align properly with chart gridlines.
.row-with-border {
  border: 1px solid #ccc;
  height: 22px;
}

.row-with-border:last-child {
  border-bottom-width: 1px;
  height: 23px;
}
Also, check out this updated sample project for complete working code.
—–
Manoj Mohan
Team CanvasJSThe project shared above seems to have some issue with dependency package when we tried to run at our end. Can you kindly create sample project along with the node_modules and share it with us over Google-Drive or Onedrive so that we can run it locally at our end, understand the scenario better and help you out?
—-
Manoj Mohan
Team CanvasJSIndexlabels are shown even when the datapoint range are partially outside the viewport region in case of range bar charts and it seems to be working fine.
Can you kindly create JSFiddle reproducing the issue you are facing and share it with us so that we can reproduce the issue at our end, understand the scenario better and help you out?
—–
Manoj Mohan
Team CanvasJS