Hello
This is Neha. I need urgent support for the below mentioned problem statements on priority
Pre-requisite
1. Angular 15
2. Data set coming as response of API (could use sample json, must not be in the same component)
Problem Statement
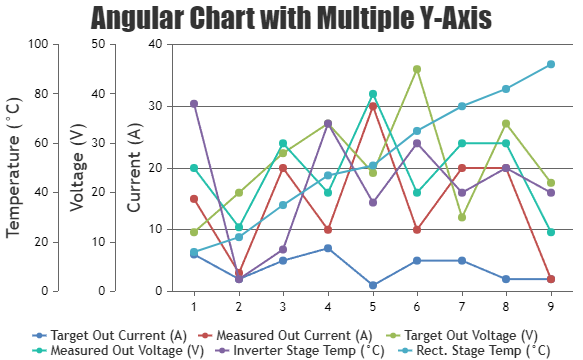
1. Multiple data sources combined in a single graph (multiple Y axis, line chart):
Target Out Current (A)
Target Out Voltage (V)
Measured Out Current (A)
Measured Out Voltage (V)
IMD Voltage (V)
Insulation (kOhm)
Measured In Current (A)
Measured In Voltage (V)
EV Battery SoC (%)
Inverter Stage Temp. (°C)
Rect. Stage Temp (°C)
Cable DC+ Temp (°C)
Cable DC- Temp (°C)
Core DC+ Temp (°C) – Only for cooled NG and MCS dispenser
Code DC- Temp (°C) – Only for cooled NG and MCS dispenser
Cable Return+ Temp (°C) – Only for cooled NG and MCS dispenser
Cable Return- Temp (°C) – Only for cooled NG and MCS dispenser
Cabinet Temp (°C) – Only for uncooled CCS dispenser
Cabinet Temp1 (°C) – Only for cooled NG and MCS dispenser
Cabinet Temp2 (°C) – Only for cooled NG and MCS dispenser
Fan speed (rpm) – Only for cooled NG and MCS dispenser
PE Start Cmd.
2. Y axes can be combined by type of measurement for better reading:
All currents (A) in same Y axis
All voltages (V) in same Y axis
All temperatures (°C) in same Y axis
3. By default the page should be loaded showing the following measurements in the graph:
Target Out Current
Target Out Voltage
Measured Out Current
Measured Out Voltage
.