Hello.
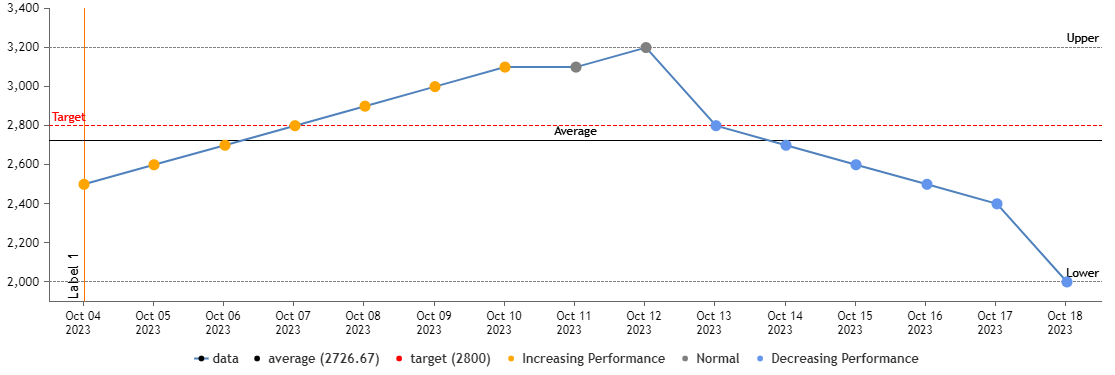
I have used CanvasJS to create a line chart. The line chart has a single line with multiple data points, however, the data point colour changes to orange to signify a positive trend. Blue data points are used to signify a decreasing trend. Grey data points signify normal occurrence.
How can I add these 3 different colour data points to my chart legend so that the audience understands what the Grey, Orange and Blue data points mean? E.g.I would like the legend to contain:
– Orange ‘Increasing Performance’
– Blue ‘Decreasing Performance’
– Grey ‘Normal’
Is this possible?
I’ve added sample code to Google Drive to better explain.
https://drive.google.com/file/d/1JKx_AZtuxqRLGukP0zJMOolpqfx6KBAL/view?usp=sharing
Many thanks.
.