Login to Ask a Question or Reply
Forum Replies Created by Manoj Mohan
-
October 24, 2019 at 10:57 pm in reply to: Dynamically generated chart displaying wrong format #27240
Stacked Bar Charts are plotted when multiple Bar Charts with aligned x values are plotted on same axis. Adding x-values to the dataPoints should work fine in your case.
—-
Manoj Mohan
Team CanvasJSThe interval and range of axis are calculated based on the height and width of the chart. You can use get method to fetch the interval, maximum and minimum value of the axisY from the first chart and set the same value for the second chart using set method as shown in this JSFiddle.
—-
Manoj Mohan
Team CanvasJSYou can set the culture property of the chart to achieve your requirement. Please refer to this documentation page for more information and live example for the same.
—-
Manoj Mohan
Team CanvasJSSudha,
Glad that you figured it out :)
—-
Manoj Mohan
Team CanvasJSYou can use interval and intervalType property of axisX to set interval as per your requirement.
If this doesn’t fulfill your requirement, kindly share sample project / pictorial representation and brief us more about your requirement so that we can understand your scenario better and help you out.
—-
Manoj Mohan
Team CanvasJSCan you kindly share a sample project/pictorial representation and brief us more about your requirements so that we can understand your scenario better and help you out?
—-
Manoj Mohan
Team CanvasJSPlease take a look at this sample project for integrating CanvasJS with VueJS.
If you are still facing the issue, kindly share a sample project along with the sample data reproducing the issue so that we can understand your scenario better and help you to resolve it.
—-
Manoj Mohan
Team CanvasJSSetting labelAutoFit to false of axisX should work fine in your scenario. Please take a look at this updated JSFiddle.
—–
Manoj Mohan
Team CanvasJSDo you see any problem doing this?
You can easily replace your existing chart with CanvasJS without any problem. Please take a look at this example which shows rendering chart in PHP using data from XML.
Can you help me or will I have to hire a developer (or do it myself)
Sorry, we don’t develop applications. However, you can check out our documentation and gallery page on PHP which will help you to easily migrate to CanvasJS charts.
—-
Manoj Mohan
Team CanvasJS1) I have a Bar Chart with two Lines (target values and limits). My Problem here is, I can’t get the lines to start at the very beginning of the x-axis and end at the very end of the x-axis.
You can use stripLines on axisY to achieve the above requirement. Please take a look at the documentation page for more information and live example.
2) I need to be able to add HTML-Code to Headlines, will this be possible in the near future?
HTML is not supported in title as of now. However, you can use unicode to show subscript as shown in this JSFiddle.
—-
Manoj Mohan
Team CanvasJSIt seems like you have missed out updating stripLine values. Adding the following lines should work fine in your case.
chart.axisX[0].stripLines[0].set("value", chart.axisX[0].get("viewportMaximum"));
chart.axisY[0].stripLines[0].set("value", chart.axisY[0].get("viewportMaximum"));
—-
Manoj Mohan
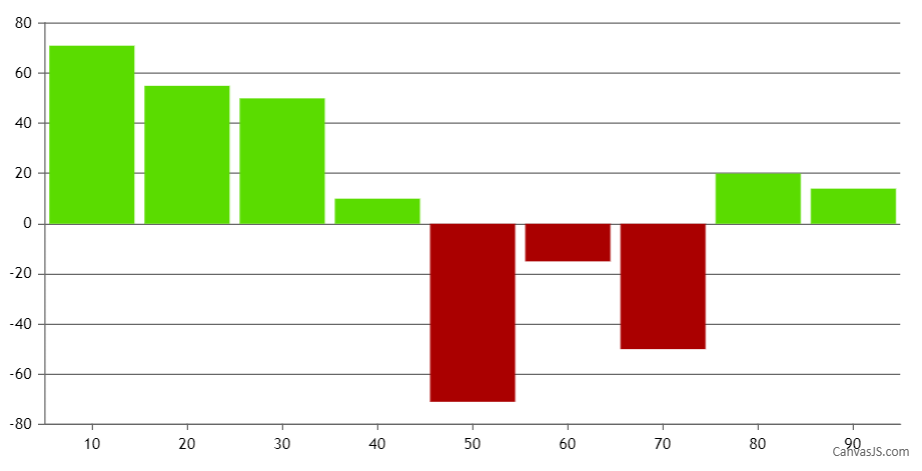
Team CanvasJSOctober 7, 2019 at 6:04 pm in reply to: how to change color of column in column chart based on values #27007You can change the color of column using color property of dataPoint as shown in the code snippet below –
function setColor(chart){
	for(var i = 0; i < chart.options.data.length; i++) {
  	dataSeries = chart.options.data[i];
  	for(var j = 0; j < dataSeries.dataPoints.length; j++){
    	if(dataSeries.dataPoints[j].y <= 0)
      	dataSeries.dataPoints[j].color = 'rgb(170, 0, 0)';
    }
  }
}
Also, please take a look at this JSFiddle which shows setting different colors to positive and negative values.

—-
Manoj Mohan
Team CanvasJSIt’s not possible to position indexLabel with an angle. As of now, it can either be positioned vertical or horizontal. However, we will reconsider this behavior in future versions.
—-
Manoj Mohan
Team CanvasJS