Login to Ask a Question or Reply
You must be logged in to post your query.
Home › Forums › Chart Support › Can CanvasJS reproduce this chart?
Can CanvasJS reproduce this chart?
- This topic has 6 replies, 2 voices, and was last updated 6 years, 9 months ago by
Atom.
-
October 2, 2019 at 4:17 pm #26965
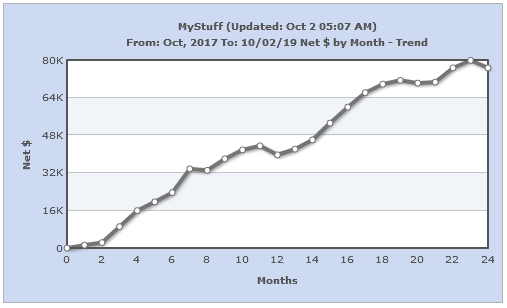
I would like to know if this chart can be produced using CanvasJS more or less exactly (especially the border color and the interior color) .
-
This topic was modified 6 years, 9 months ago by
October 3, 2019 at 7:40 pm #26981October 9, 2019 at 7:56 am #27023Thanks for your help. I’m just getting started with the trial version here:
http://www.siftradingsystems.com/BlankPage_New8.htmlHow do I set a uniform border around the chart interior?
October 9, 2019 at 12:17 pm #27027It seems like you have missed out updating stripLine values. Adding the following lines should work fine in your case.
chart.axisX[0].stripLines[0].set("value", chart.axisX[0].get("viewportMaximum"));
chart.axisY[0].stripLines[0].set("value", chart.axisY[0].get("viewportMaximum"));
—-
Manoj Mohan
Team CanvasJSOctober 9, 2019 at 5:43 pm #27030Ok, that worked, thanks. I think I can see how CanvasJS will work for me, so let’s look at the big picture.
My website is hosted on HostGator. http://www.siftradingsystems.com/
Each system will have multiple charts, either bar or line. Chart data is uploaded to the server automatically. The XML data files look like this:<chart caption='MyStuff (Updated: Oct 9 06:08 AM)' subcaption='From: Oct, 2017 To: 10/09/19 Net $ by Month - Trend ' xAxisName='Months' yAxisName='Net $' bgColor='9AB5E4' alternateHGridColor='E3EBF5' showValues='0' labelStep='2'> <set label='0' value='0.00' /> <set label='1' value='2057.50' /> <set label='2' value='1975.00' /> <set label='3' value='12925.00' /> <set label='4' value='16460.00' /> <set label='5' value='18982.50' /> <set label='6' value='28310.00' /> <set label='7' value='32490.00' /> <set label='8' value='31487.50' /> <set label='9' value='39670.00' /> <set label='10' value='42145.00' /> <set label='11' value='43117.50' /> <set label='12' value='36377.50' /> <set label='13' value='45702.50' /> <set label='14' value='46740.00' /> <set label='15' value='57550.00' /> <set label='16' value='60987.50' /> <set label='17' value='69365.00' /> <set label='18' value='70443.61' /> <set label='19' value='68802.71' /> <set label='20' value='69332.83' /> <set label='21' value='74608.13' /> <set label='22' value='79739.90' /> <set label='23' value='76395.16' /> <set label='24' value='77645.90' /> </chart>When a visitor goes to a system page they can select a chart. When a chart is selected, the page is rendered using PHP.
Here is a sample:<!DOCTYPE html> <html> <head> <meta http-equiv="Content-Type" content="text/html; charset=UTF-8"> <meta name="viewport" id="viewport" content="target-densitydpi=high-dpi,initial-scale=1.0,user-scalable=no" /> <title>'<?php echo $_GET["sysname"] ?>'</title> <link href="styles.css" rel="stylesheet" type="text/css" /> <script type="text/javascript" src="//ajax.googleapis.com/ajax/libs/jquery/1.11.0/jquery.min.js"></script> <script type="text/javascript" src="//ajax.googleapis.com/ajax/libs/jqueryui/1.10.4/jquery-ui.min.js"></script> <script type="text/javascript"> $(function(){ //option 1 //insertme('ESCombo7'); insertme('<?php echo $_GET["sysname"].$_GET["period"]."Trnd" ?>'); }); function insertme(ref) { //this can be placed in external js file var join = ""; join += '<object type="application/x-shockwave-flash" data="../FusionCharts/Line.swf" width="500" height="300">'; join += '<param name="movie" value="../FusionCharts/Line.swf" />'; join += '<param name="FlashVars" value="&dataURL=clientFTP/' + ref + '.xml&chartWidth=500&chartHeight=300">'; join += '<param name="quality" value="high" />'; join += '<embed src="../FusionCharts/Line.swf" flashVars="&dataURL=clientFTP/' + ref + '.xml&chartWidth=500&chartHeight=300" quality="high" width="500" height="300" id="Line" type="application/x-shockwave-flash" pluginspage="http://www.macromedia.com/go/getflashplayer" />'; join += '</object>'; $('#dumphere').append(join); } </script> <style type="text/css"> </style> </head> <body class="twoColFixLtHdr"> <div id="container"> <div id="header" class="fltlft"><img src="images/logo.jpg" alt="SIF Trading Systems Logo" /> <img src="images/software_box.jpg" alt="Software Box" /> </div> <br class="clearfloat" /> <div id="dumphere" style="text-align: center"> <!-- <script> ///option 2 - just remove comment tags insertme('ESCombo7'); </script>--> </div> <div style="margin-left: 200px"><br> <p>This chart is automatically updated directly from a TradeStation chart.</p><!--<p>This chart does not include the current month.</p>--> <p style="margin-right: 125px">PAST PERFORMANCE WHETHER REAL OR HYPOTHETICAL IS NO GUARANTEE OF FUTURE RESULTS.</p></div> <div id="footer"> <p><a>.html"><?php echo $_GET["sysname"] ?></a></p> </div> </div> </body> </html>I would like to keep the same basic structure for my website. I know I will have to modify the XML files for each system.
Do you see any problem doing this?
Can you help me or will I have to hire a developer (or do it myself).
Should I start another thread to ask these questions?Thanks.
-
This reply was modified 6 years, 9 months ago by
October 10, 2019 at 7:31 pm #27063Do you see any problem doing this?
You can easily replace your existing chart with CanvasJS without any problem. Please take a look at this example which shows rendering chart in PHP using data from XML.
Can you help me or will I have to hire a developer (or do it myself)
Sorry, we don’t develop applications. However, you can check out our documentation and gallery page on PHP which will help you to easily migrate to CanvasJS charts.
—-
Manoj Mohan
Team CanvasJSOctober 10, 2019 at 9:11 pm #27073Thank you.
-
This topic was modified 6 years, 9 months ago by
You must be logged in to reply to this topic.