Login to Ask a Question or Reply
Forum Replies Created by Indranil
-
March 2, 2018 at 10:04 am in reply to: How can i get access to a canvasJS chart through a DOM-Container #19810
$("#container").CanvasJS()will work with jQuery Charts. In case you have some other requirement please create a jsfiddle so that we can understand your requirement better and help you out.___________
Indranil Deo,
Team CanvasJSPlease download this sample project for integrating CanvasJS in React+Webpack.
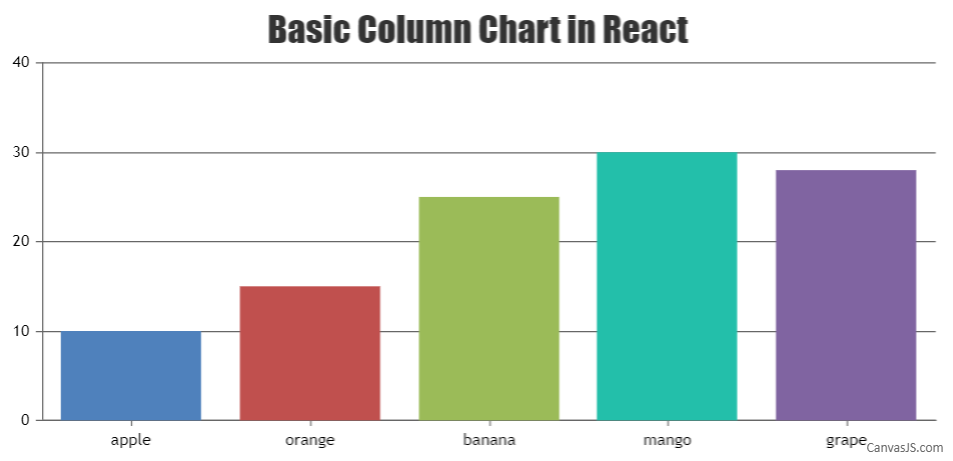
For integrating CanvasJS in React please refer to the below code snippet –
class Chart extends React.Component {
    componentDidMount() {
        var chart = new CanvasJS.Chart("chartContainer", {
            animationEnabled: true,
            title:{
              text: "Basic Column Chart in React"
            },
            data: [
              {
                type: "column",
                dataPoints: [
                  { label: "apple",  y: 10  },
                  { label: "orange", y: 15  },
                  { label: "banana", y: 25  },
                  { label: "mango",  y: 30  },
                  { label: "grape",  y: 28  }
                ]
              }
            ]
        });
    chart.render();
  }
  render() {
    return (
      <div id="chartContainer" style={{height: 360 + "px", width: 100 + "%"}}>
      </div>
    );
  }
}

// ========================================

ReactDOM.render(
  <Chart />,
  document.getElementById('root')
);
Also, kindly take a look at this JSFiddle for a working sample.

___________
Indranil Deo
Team CanvasJSIt is not possible to add <br> to label as of now instead, you can use labelMaxWidth property of axisX/axisY to wrap the label once the label-width reaches the specified max-width.
Please take a look at this jsfiddle.
___________
Indranil Deo,
Team CanvasJSThe package mentioned above is not official but from a third party. However, CanvasJS Chart works fine with React. Below are the steps to integrate CanvasJS Chart / StockChart in your react app.
1. Save canvasjs.react.js and canvasjs.min.js(canvasjs.stock.react.js and canvasjs.stock.min.js in case of StockChart) within source-folder of your React application ( src or src/assets or src/lib ).
2. Import the library into your app.
For Chart:
import CanvasJSReact from './canvasjs.react';
var CanvasJSChart = CanvasJSReact.CanvasJSChart;For StockChart:
import CanvasJSReact from './canvasjs.stock.react';
var CanvasJSStockChart = CanvasJSReact.CanvasJSStockChart;Once it’s imported, you are ready to go. Now you can create Chart / StockChart, pass options & render them.
Please check out React Gallery for examples on integrating charts in React app.

___________
Indranil Deo
Team CanvasJSFebruary 26, 2018 at 10:01 am in reply to: How can I make pausable, interactive financial chart stock simulator? #19760February 26, 2018 at 10:01 am in reply to: In linechart have option/way chart some margin from right side #19759Are you trying to set extra space after the last dataPoint? If so you can set axisX maximum to do so. If not can you kindly give a pictorial representation of your requirement so that we can understand it better and help you out?
___________
Indranil Deo,
Team CanvasJSFebruary 23, 2018 at 6:54 pm in reply to: How can I make pausable, interactive financial chart stock simulator? #19742Dynamic/Live chart is available in CanvasJS, please take a look at Tutorial on Creating Dynamic Charts. You can start / stop live update of chart as shown in this jsfiddle.
1)automatic scaling to fit in entire price range when price moves out of bounds of the canvas – all bars should adjust their size accordingly,
zoom in\outThe width of bars auto-adjusts itself based on the size of the chart and the viewport-range on zooming the chart.
2)speed adjusting slider to slow down/increase the drawing speed
You can handle this by changing update-interval in the above jsfiddle, as slider is moved.
___________
Indranil Deo
Team CanvasJSThe chart gets resized as the axisY labelFormatter formats labels and returns labels with 14 digit decimal value.
Setting the precision to 2 digits after the decimal point should work fine in this case. Please take a look at this updated jsfiddle.___________
Indranil Deo,
Team CanvasJS-
This reply was modified 7 years, 11 months ago by
Indranil.
Can you please create a jsfiddle reproducing the issue so that we can understand it better and help you out.
___________
Indranil Deo,
Team CanvasJs@Eve,
As of now, we don’t support API to build a plugin. We will consider it for future releases.
___________
Indranil Deo,
Team CanvasJSFebruary 20, 2018 at 9:39 am in reply to: Set maximum of a data series from the legend click event #19686You can achieve this by changing the minimum and maximum of the chart options on legend click and rendering the chart. Please take a look at this jsfiddle.
___________
Indranil Deo,
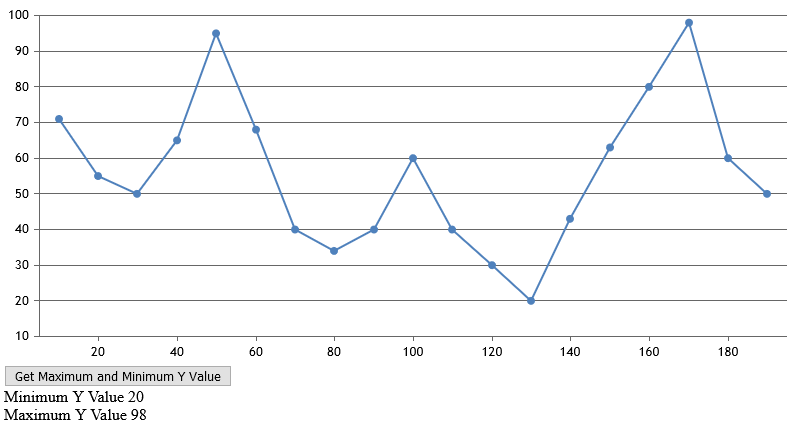
Team CanvasJSFebruary 19, 2018 at 10:18 am in reply to: can we get series minimum and maximum value of datapoints #19678It is not possible to get the minimum and maximum y value in a series directly as of now. However, with few lines of code, you can achieve this. Please take a look at this JSFiddle.

___________
Indranil Deo,
Team CanvasJS -
This reply was modified 7 years, 11 months ago by