Login to Ask a Question or Reply
Forum Replies Created by Indranil
-
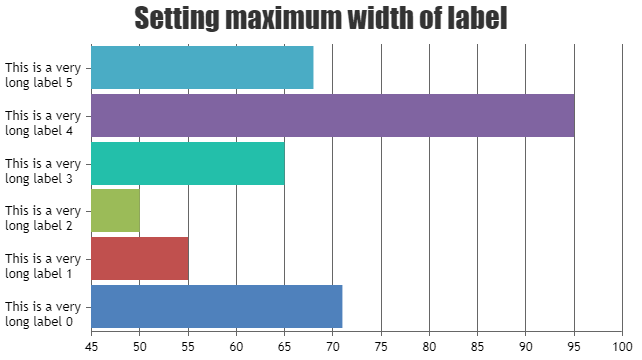
HTML tags are not supported in title, labels and other elements except toolTip, as of now. However to break the axis label, you can set labelMaxWidth property which wraps the axis labels if width of labels exceeds the max-width of it.

___________
Indranil Deo
Team CanvasJSWe were unable to reproduce the issue at our end. However, you can refer to this example which is similar to your scenario.
If this doesn’t help kindly share a JSFiddle reproducing the issue so that we can look into the code, understand the scenario better and help you out
___________
Indranil Deo
Team CanvasJSYou can customize interval according to your requirements by setting interval and intervalType properties. Please refer documentation for more customization options available.
___________
Indranil Deo
Team CanvasJSThere seems to be a typo, please try changing the value of xValueType from “datetime” to “dateTime”.
You may need to convert PHP timestamp to JavaScript timestamp as PHP timestamp is in seconds and JavaScript timestamp is in milliseconds. Please refer this stackoverflow thread for more info.
___________
Indranil Deo
Team CanvasJSYou can fetch the date-time in timestamp format with its corresponding y value, parse it into format CanvasJS accepts and use the same to render the chart. Please take a look at this example to render chart from timestamp in PHP.
___________
Indranil Deo
Team CanvasJSThanks for reporting the use-case. We will look into it and fix it in future releases.
___________
Indranil Deo
Team CanvasJSThe behavior is designed such that zooming is limited upto a certain region, so the user doesn’t end up zooming into a blank-region (region with no dataPoints). To zoom into a certain region, there should be around 4 dataPoints. In your case, zoomType: ‘x’ should work fine as zoomType: ‘y’ / ‘xy’ would be limited to just 3 dataPoints with different values over the y-axis. Please take a look at this documentation page for information on zoomType option.
___________
Indranil Deo
Team CanvasJS-
This reply was modified 6 years, 8 months ago by
Indranil.
Thanks for sharing the use-case. We are looking into it get back to you at the earliest.
___________
Indranil Deo
Team CanvasJSYou can save the chart as image on the server with the help of headless browser like PhantomJS.
Please take a look at this sample PhantomJS project, that captures the chart image from web page and saves it to a particular location. Please refer to instructions.txt file for setup instruction.
___________
Indranil Deo
Team CanvasJSExporting chart as an image will export the chart along with all the elements except toolTip. If you like to add information about the dataPoint, you can use indexLabel and export it as an image.
___________
Indranil Deo
Team CanvasJSThe look & feel of title, label depends on font-family being used. You can customize the font-family of text by setting fontFamily property.
___________
Indranil Deo
Team CanvasJSJune 7, 2019 at 6:53 pm in reply to: Column missing in column chart when maximum value is set for Y-axis. #25437Thanks for reporting the use case. We will look into it and will get back to you at the earliest.
___________
Indranil Deo
Team CanvasJS@bux,
You can pass the x-value, y-value and the toolTipText through a JSON API, use the same(x-value, y-value) to position the image/marker over the chart and add the toolTipText to it. Please take a look at this updated JSFiddle.
___________
Indranil Deo,
Team CanvasJS -
This reply was modified 6 years, 8 months ago by