Login to Ask a Question or Reply
Forum Replies Created by Indranil
-
Please take a look at this JSFiddle to render a multi-series chart from an external JSON file.
If this doesn’t fit your requirements kindly help us with an example and brief us further about your exact requirement so that we can understand the scenario better and help you out. Also please do share your sample data.
___________
Indranil Deo
Team CanvasJSYou can pre-select one of the dataSeries when page loads by setting the
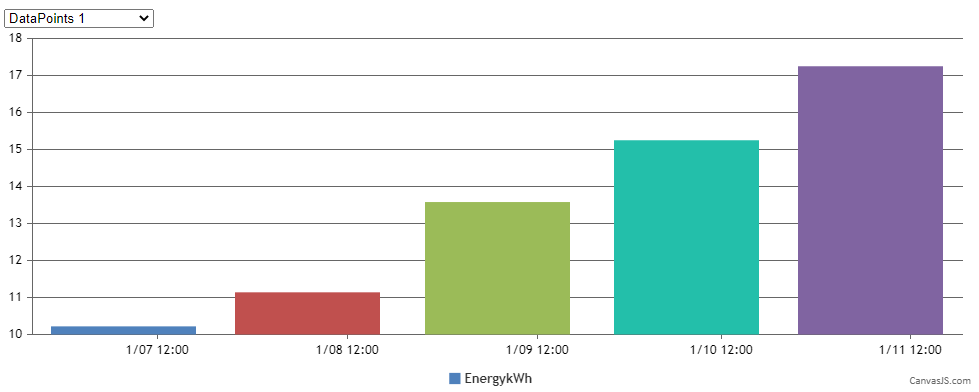
selectedattribute to the corresponding dropdown list option as shown below –<option value="dps1" selected="selected">DataPoints 1</option>Please take a look at this JSFiddle for a working sample.

___________
Indranil Deo
Team CanvasJSIn JavaScript, Array length can go upto 2^32−1 as mentioned in the ECMA documentation. CanvasJS can easily render a large number of dataPoints without any issue. Please check this performance test page for an example with 50000 dataPoints.
Can you please create and share a JSFiddle reproducing the issue so that we can look into the code, understand the scenario better and help you out.
___________
Indranil Deo
Team CanvasJSThe script available in CDNJS is outdated and not published by us. We recommend you to download the latest version of CanvasJS from our download page.
You can load external libraries to your project in dojo as mentioned in this documentation page. Please take a look at this JSFiddle for an example.
___________
Indranil Deo
Team CanvasJSCan you please create a sample project reproducing the issue and share it over Google-Drive or One-Drive along with sample data so that we can look into the code, understand the scenario better and help you out?
___________
Indranil Deo
Team CanvasJSTo use CanvasJS, you need to render the chart inside a web page environment. IN MIT AI2, this can be achieved using the WebViewer component.
___________
Indranil Deo
Team CanvasJSCan you please share a screenshot and brief us further about your requirements so that we can understand your scenario better and help you out with an appropriate solution.
___________
Indranil Deo
Team CanvasJSPlease take a look at this gallery example for creating a Dynamic chart in PHP. To trigger the shift operation in the dataPoints please use the shift() as shown in this documentation page.
___________
Indranil Deo
Team CanvasJSPlease take a look at this documentation page for step by step instruction to create a chart with draggable dataPoints. The shown example works fine across JS frameworks like React, Angular, etc.
___________
Indranil Deo
Team CanvasJSJim,
Thanks for your appreciation. Feedback from users like you makes our day happier.
___________
Indranil Deo
Team CanvasJSJoa,
The JSFiddle shared seems to be working fine. Kindly check browser console for any errors.
If you are facing any other issue with CanvasJS, kindly create JSFiddle reproducing the issue you are facing and share it with us so that we can look into the code, understand the scenario better and help you out.
___________
Indranil Deo
Team CanvasJSFebruary 10, 2020 at 8:13 pm in reply to: Custom Graph with arrow placed at pre-selected X value #28356I want to send an X value to this chart and have it selected, so the tool tip shows up where that X point is. How could I do that?
Showing toolTip programmatically is not possible as of now. However, this feature is there in our wish-list and would be available in future versions.
Additionally, I want to add a vertical arrow from the top of the red area to the top of the blue line as shown in the first image.
Adding arrow/custom drawing on chart is not available as an inbuild feature, as of now.
___________
Indranil Deo
Team CanvasJS