Login to Ask a Question or Reply
You must be logged in to post your query.
Home › Forums › Chart Support › Charts with drop down button to filter
Charts with drop down button to filter
- This topic has 24 replies, 10 voices, and was last updated 2 years, 3 months ago by
Sachin Bisht.
Tagged: chart filter, drop-down menu
-
January 16, 2018 at 3:14 am #18849
Hi, I am looking a tutorial or a chart code to do a bar chart in which the user can filter by category with a drop-down menu and the bar chart changes. I’ve created something with tableau (using the filter), but I would like to learn with JS (I’m a beginner). If you could help me, I’d highly appreciate it!
(Sorry if the answer is somewhere… I looked, but I didn’t find anything)
January 16, 2018 at 10:32 am #18852Based on your requirement it seems you are trying to render a chart corresponding to the options selected from a dropdown list. If so, please check this JSFiddle example.
You can update the chart options / data based on the options selected from dropdown list as shown below –
$( ".dropdown" ).change(function() {
    chart.options.data[0].dataPoints = [];
    var e = document.getElementById("dd");
    var selected = e.options[e.selectedIndex].value;
    dps = jsonData[selected];
    for(var i in dps) {
      var xVal = dps[i].x;
      chart.options.data[0].dataPoints.push({x: new Date(xVal), y: dps[i].y});
    }
  chart.render();
});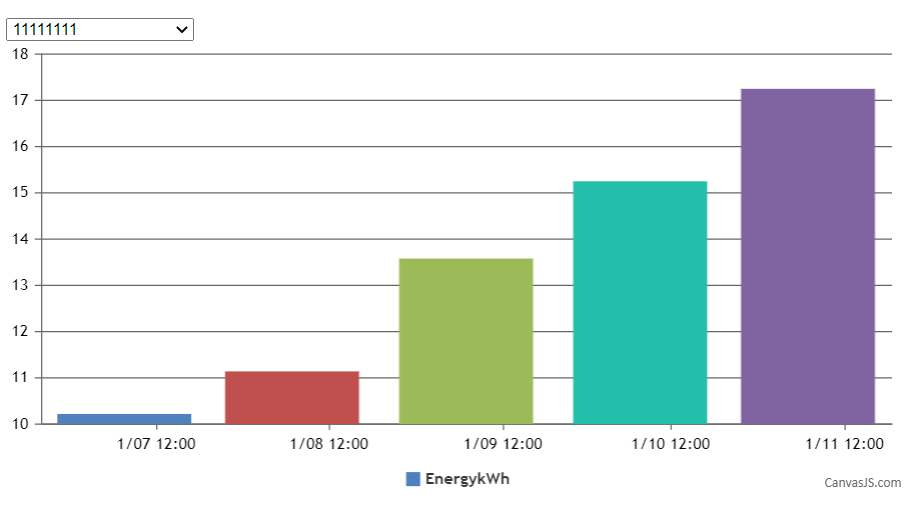
___________
Indranil Deo
Team CanvasJSJanuary 16, 2018 at 3:41 pm #18859Exactly!! Thank you so much!!!
January 18, 2018 at 4:29 am #18883Hi Indranil,
I’ve got a problem using the code you shared and I cannot find where I’m making a mistake.I’ve been changing the code from the model, but as soon I change the “X” values by names instead of dates I lose the values in the chart and the chart is empty
I think that there’s something in this part: chart.options.data[0].dataPoints.push({x: new Date(xVal), y: dps[i].y}); that I need to modify, but I cannot find the answer.
You can have a look here to my code.
Thanks in advance!
January 18, 2018 at 9:43 am #18887The json in the fiddle that you have shared has label and y-value, where as while parsing the json you are trying to read x-value and y-vlaue out of it. Replacing x-value with label while parsing should work fine in your case.
chart.options.data[0].dataPoints.push({label: dps[i].label, y: dps[i].y});Please take a look at the updated jsfiddle.
—
Vishwas R
Team CanvasJSJanuary 18, 2018 at 3:24 pm #18893That’s great! Thank you so much for your help. It’s exactly what I need.
January 18, 2018 at 4:34 pm #18894I’ve created three different charts following the model you linked, and I want all of them in the same page.
I did before here using Canvas tutorial. But it seems I need to do something different this time.
I’ve updated the jsfiddle with some of the code I’m working on.
Any idea…
Thanks!!
January 18, 2018 at 7:20 pm #18895You just need to have separate charts for each dropdowns as shown in the code snippet below –
var dataPoints1 = [];
var chart1 = new CanvasJS.Chart("chartContainer1", {
	animationEnabled: true,
	axisX: {
		interval: 1,
		labelMaxWidth: 1000,
		labelFontSize:11,
		reversed: true
	},
	axisY2:{
		interlacedColor: "rgba(1,77,101,.2)",
		gridColor: "rgba(1,77,101,.1)",
		title: ""
	},

	data: [{
		type: 'bar',
		color: "#014D65",
		//xValueFormatString:"D MM h:mm",
		name: "series1",
		dataPoints: dataPoints1 // this should contain only specific serial number data

	}]
});

$( "#dd" ).change(function() {
	chart1.options.data[0].dataPoints = [];
	var e = document.getElementById("dd");
	var selected = e.options[e.selectedIndex].value;
	dps = jsonData1[selected];
	for(var i in dps) {
		chart1.options.data[0].dataPoints.push({label: dps[i].label, y: dps[i].y});
	}
	chart1.render();
});

var dataPoints2 = [];
var chart2 = new CanvasJS.Chart("chartContainer2", {
	animationEnabled: true,
	axisX: {
		interval: 1,
		labelMaxWidth: 1000,
		labelFontSize:11,
		reversed: true
	},
	axisY2:{
		interlacedColor: "rgba(1,77,101,.2)",
		gridColor: "rgba(1,77,101,.1)",
		title: ""
	},

	data: [{
		type: 'bar',
		color: "#53B17B",
		//xValueFormatString:"D MM h:mm",
		name: "series1",
		dataPoints: dataPoints2 // this should contain only specific serial number data

	}]
});

$( "#second" ).change(function() {
	chart2.options.data[0].dataPoints = [];
	var e = document.getElementById("second");
	var selected = e.options[e.selectedIndex].value;
	console.log(selected)
	dps = jsonData2[selected][0];
	for(var i in dps) {
		chart2.options.data[0].dataPoints.push({label: dps[i].label, y: dps[i].y});
	}
	chart2.render();
});
Please take a look at this updated jsfiddle.
—
Vishwas R
Team CanvasJSJanuary 21, 2018 at 4:55 pm #18908Got it!! Thanks a lot!
December 3, 2018 at 2:37 pm #23635Hi Carmen previous example how to set Initail value for first showing graph
May 15, 2019 at 2:06 pm #25186Hi, I am looking for similar drop down filter in php but with database search. I want to filter my charts using Year-wise that will display total number of appointments in each skill for that selected year.
Here is my php code where I tried to plot two graphs, one for all years and next for selection by year.
Much thanks for your help please.
<?php

$dataPoints = array();
$dataPoints2018 = array();
//Best practice is to create a separate file for handling connection to database
try{
     // Creating a new connection.
    // Replace your-hostname, your-db, your-username, your-password according to your database
    $link = new \PDO(   'mysql:host=localhost;dbname=project;charset=utf8mb4', //'mysql:host=localhost;dbname=canvasjs_db;charset=utf8mb4',
                        'root', //'root',
                        '', //'',
                        array(
                            \PDO::ATTR_ERRMODE => PDO::ERRMODE_EXCEPTION,
                            \PDO::ATTR_PERSISTENT => false
                        )
                    );
	// qurey for chart render for total appointments for all time topic-wise
    $handle = $link->prepare("SELECT COUNT(*) as count, a.id_skill, a.ap_meet_date, s.skill FROM appointment a,skills_data s WHERE a.id_skill=s.id_skill and a.ap_status = 'complete' GROUP BY <code>id_skill</code>");
    $handle->execute();
    $result = $handle->fetchAll(\PDO::FETCH_OBJ);

    foreach($result as $row){
        array_push($dataPoints, array("label"=> $row->skill, "y"=> $row->count));
    }
    $link = null;


    // OTHER USEFUL QUERIES

    // qurey for disticnt years in appointment table
    $year = ("SELECT DISTINCT YEAR(ap_meet_date) FROM appointment As YEAR");

    // qurey for chart render for total appointments topic-wise in each year
    $sesult_by_year = ("SELECT a.id_skill, YEAR(a.ap_meet_date) As YEAR, s.skill,COUNT(*) as count FROM appointment a,skills_data s WHERE a.id_skill=s.id_skill and a.ap_status = 'complete' GROUP BY <code>id_skill</code>, <code>YEAR</code> ORDER BY <code>YEAR</code>");

    // example query for 2017 and 2018 that can be used to print directly for 2017 and 2018
    $result_2017 = ("SELECT a.id_skill, YEAR(a.ap_meet_date) As YEAR, s.skill,COUNT(*) as count FROM appointment a,skills_data s WHERE a.id_skill=s.id_skill AND a.ap_status = 'complete' AND YEAR(a.ap_meet_date) = '2017' GROUP BY <code>id_skill</code>");
    $result_2018 = ("SELECT a.id_skill, YEAR(a.ap_meet_date) As YEAR, s.skill,COUNT(*) as count FROM appointment a,skills_data s WHERE a.id_skill=s.id_skill AND a.ap_status = 'complete' AND YEAR(a.ap_meet_date) = '2018' GROUP BY <code>id_skill</code>");

    foreach($result as $row){
        array_push($dataPoints2018, array("label"=> $row->skill, "y"=> $row->count));
    }
    $link = null;

}
catch(\PDOException $ex){
    print($ex->getMessage());
}

?>
<!DOCTYPE HTML>
<html>
<head>

<!-- Script to render pie chart for total count in all years   -->
<script>
window.onload = function () {

var chart = new CanvasJS.Chart("chartContainer", {
	animationEnabled: true,
	exportEnabled: true,
	theme: "light1", // "light1", "light2", "dark1", "dark2"
	title:{
		text: "Skills Distribution"
	},
	data: [{
		type: "pie", //change type to bar, line, area, pie, etc
		startAngle: 25,
		toolTipContent: "<b>{label}</b>: {y}",
// 		toolTipContent: "<b>{label}</b>: {y}%",
		showInLegend: "true",
		legendText: "{label}",
		indexLabelFontSize: 16,
		indexLabelPlacement: "inside",
		indexLabel: "{y}",
// 		indexLabel: "{label} - {y}",
// 		indexLabel: "{label} - {y}%",
		dataPoints: <?php echo json_encode($dataPoints, JSON_NUMERIC_CHECK); ?>
	}]
});
chart.render();

}
</script>

</head>
<body>

<!-- Renders pie chart for total count in all years   -->
<div id="chartContainer" style="height: 370px; width: 900px;"></div>

<!-- To render pie chart based on Dropdown filter using database   -->
<!-- Dropdown filter using database   -->
<br/>
<select class="dropdown" id="dd">
    <option value="" selected="selected">Select Year</option>
    <?php
    if (! empty($distinct_years)) {
        foreach ($distinct_years as $key => $value) {
            echo '<option value="' . $distinct_years[$key]['YEAR'] . '">' . $distinct_years[$key]['YEAR'] . '</option>';
             }
         }
    ?>
</select>


<!-- To render pie chart based on Dropdown filter using database   -->
<script type="text/javascript">
var dataPoints = [];
var chart = new CanvasJS.Chart("chartContainer2018",
{
	animationEnabled: true,
	exportEnabled: true,
	theme: "light1", // "light1", "light2", "dark1", "dark2"
  },
	data: [{
    showInLegend: true,
    type: 'pie',
    startAngle: 25,
	toolTipContent: "<b>{label}</b>: {y}",
    showInLegend: true,
    legendText: "{label}",
    dataPoints2018: <?php echo json_encode($dataPoints2018, JSON_NUMERIC_CHECK); ?>
//     dataPoints: dataPoints
	}]
});

$( ".dropdown" ).change(function() {
	chart.options.data[0].dataPoints2018 = [];
  var e = document.getElementById("dd");
	var selected = e.options[e.selectedIndex].value;
	YEAR = jsonData[selected];
//   dps = jsonData[selected];
  for(var i in YEAR) {
  	var xVal = dps[i].x;
    chart.options.data[0].dataPoints2018.push({x: new Date(YEAR), y: YEAR[i].y});
  }
  chart.render();
});

</script>
<div id="chartContainer2018" style="height: 370px; width: 900px;"></div>

<script src="https://cdn.canvasjs.com/canvasjs.min.js"></script>
</body>
</html>
May 16, 2019 at 5:59 pm #25204To create a chart based on dropdown selection in PHP using data from database, you need to first create a PHP service that will provide data for a corresponding year from database. Please check the below code snippet to create such a service –
getData.php
<?php
header('Content-Type: application/json');

	$link = new \PDO(   'mysql:host=localhost;dbname=canvasjs_db;charset=utf8mb4', //'mysql:host=localhost;dbname=canvasjs_db;charset=utf8mb4',
                        'root', //'root',
                        '', //'',
                        array(
                            \PDO::ATTR_ERRMODE => PDO::ERRMODE_EXCEPTION,
                            \PDO::ATTR_PERSISTENT => false
                        )
                    );
	$handle = $link->prepare("SELECT * FROM datapoints where YEAR(x) = :year order by x");
	$handle->bindParam(":year",$_GET["year"], PDO::PARAM_INT);
    $handle->execute();
    $result = $handle->fetchAll(\PDO::FETCH_OBJ);
	$data_points = array();
	foreach($result as $row){
		// x column is in timestamp, convert unixtimestamp(seconds) to javascript timestamp(milliseconds) by multipying the x value by 1000 Please refer https://stackoverflow.com/a/15593812 for more information
        array_push($data_points, array("x"=> strtotime($row->x)*1000, "y"=> $row->y));
    }
	$link = null;

echo json_encode($data_points, JSON_NUMERIC_CHECK);
Then call the above service when an option is selected from a dropdown and render the chart based on the data received as a result from the service. Please check the below code snippet –
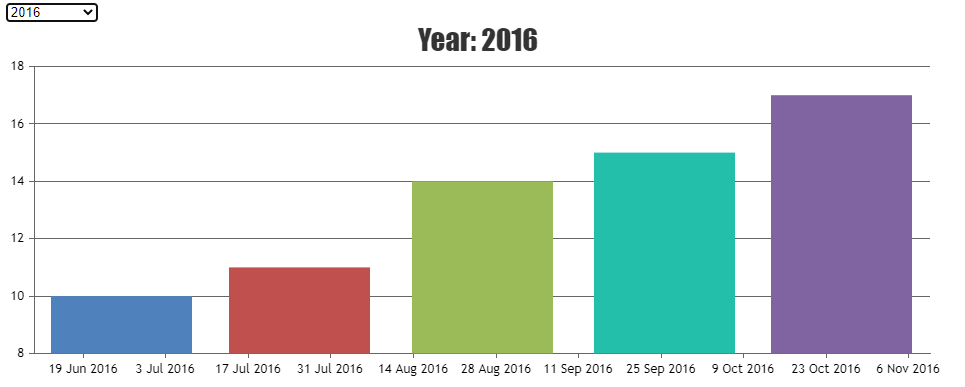
$( ".dropdown" ).change(function() {
	chart.options.data[0].dataPoints = [];
	var e = document.getElementById("dd");
	var selectedYear = e.options[e.selectedIndex].value;
	if( !isNaN(Number(selectedYear)) ) {
		chart.options.title.text = "Year: " + selectedYear;
		chart.options.title.verticalAlign = "top";
		var data = { "year" : selectedYear }
		$.getJSON("getData.php", data, function(result){
			chart.options.data[0].dataPoints = result;
			chart.render();
		})
	} else {
		chart.options.title.text = "Select Year From Dropdown";
		chart.options.title.verticalAlign = "center";
	}
	chart.render()
});
Also, kindly take a look at this sample project for a working example.
Considering this as a duplicate of Apply dropdown filter in php with database search. Hence, closing the same.
——
Manoj Mohan
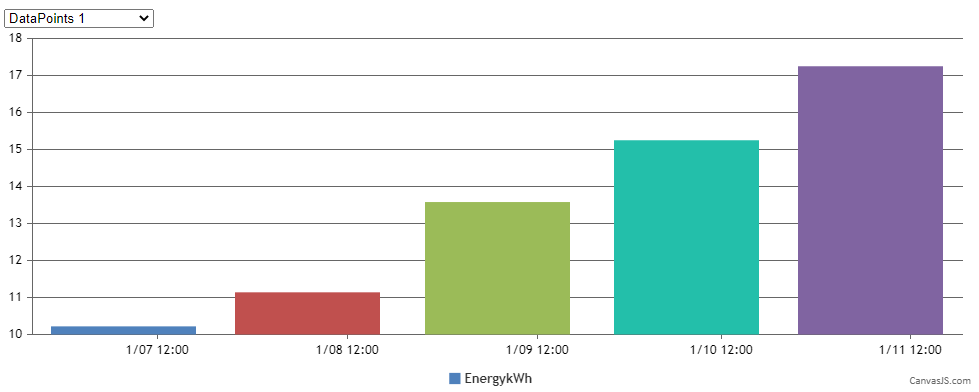
Team CanvasJSMarch 24, 2020 at 9:59 pm #28741@indranil This is in reference to reply #18852. The jsfiddle example you provided is exactly what I’ve been looking for but with one change needed… I need the first dataset chart to render. I can’t for the life of me figure out how to get “DataPoints 1” to display on the page as the default view. Any help is greatly appreciated. Hope this makes sense.
March 26, 2020 at 6:53 pm #28753You can pre-select one of the dataSeries when page loads by setting the
selectedattribute to the corresponding dropdown list option as shown below –<option value="dps1" selected="selected">DataPoints 1</option>Please take a look at this JSFiddle for a working sample.
___________
Indranil Deo
Team CanvasJSMarch 26, 2020 at 9:43 pm #28758Thank you Indranil! That’s perfect. One last question on this… is there a way to add animationEnabled: true; to the graphs so as the user clicks the select option, the new graph animates on view?
Tagged: chart filter, drop-down menu
You must be logged in to reply to this topic.