Login to Ask a Question or Reply
Forum Replies Created by Bivek Singh
-
dataPoints is an array of objects but you seem to be pushing arrays of dataPoints values. You need to format your data according to the format required by canvasJS.
—-
Bivek Singh,
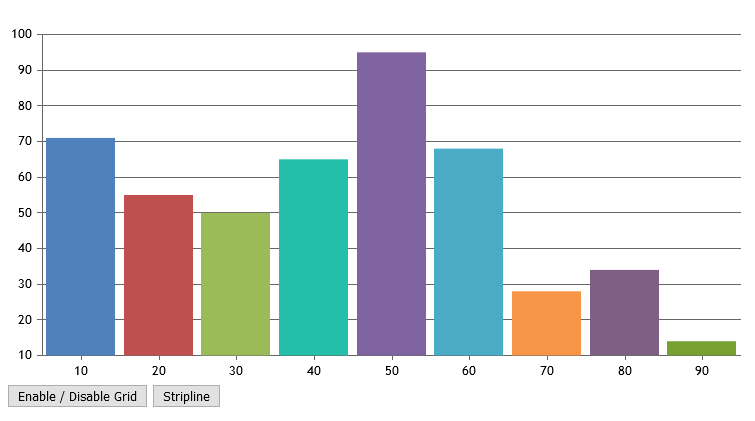
Team CanvasJSYou can disable the rendering of chart each time a stripline is added by setting the fourth parameter to false in addTo method. It is taking long time to render since you’re rendering the chart each time a stripline is added as the fourth parameter is set to true by default. You will still need to render the chart once you are done with adding all the striplines.
$.each(data, function(key, value){
    chart.axisX[0].addTo("stripLines", {value: value, lineDashType: "dot"}, 0, false);
});
chart.render();
Please update the changes in your code and it should work fine.
—-
Bivek Singh,
Team CanvasJSHannah,
Legends are not shown as you have set showInLegend to false.
—-
Bivek Singh,
Team CanvasJSJuly 4, 2017 at 7:06 pm in reply to: How to Create the Chart Container Dynamically and Load Data Inside it #15481You can customize toolTip without setting labels. You can use toolTipContent or contentFormatter for modifying the toolTip content as per your requirement.
Let us know if this solves your problem.—-
Bivek Singh,
Team CanvasJSJune 29, 2017 at 11:31 am in reply to: Using StackedArea100 % chart not covering full background #15449@prathamesh,
We have replied you on another post that you created for same topic. Please refer the post from here.
—-
Bivek Singh,
Team CanvasJS@prathamesh,
You can set maximum and minimum for axisX to allocate some extra space at the beginning and ending of the chart plotArea. This will solve your problem of not being able to hover. Please take a look at this jsFiddle.
However, if you want to expand the chart plotArea to 100% of the canvas, you can take a look at this work-around without editing the source file.
If this doesn’t solve our problem, please let us know and we’ll assist you further for it.—-
Bivek Singh,
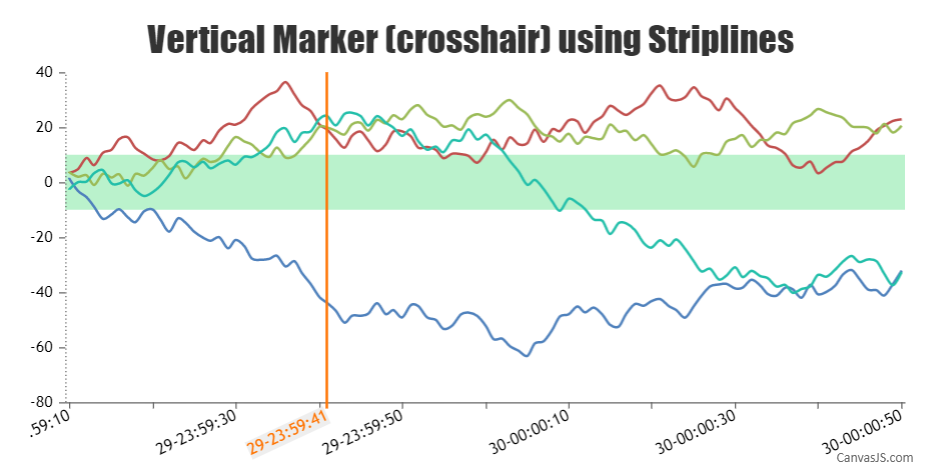
Team CanvasJSYou can add stripLine for drawing a vertical line along axisX as shown in the code snippet below –
function stripLineHandler(position){
  if(!chart.options.axisX){
    chart.options.axisX ={};
  }
  if(!chart.options.axisX.stripLines){
    chart.options.axisX.stripLines = [];
  }
  chart.options.axisX.stripLines[0] = {
    value : position,
    thickness: 2,
    //color:"red",
    showOnTop: true,
    label: (new Date(position).getDate()+"-"+new Date(position).getHours()+":"+new Date(position).getMinutes()+":"+new Date(position).getSeconds()),
    labelPlacement: "outside"
  }
  chart.render();
 }
Please take a look at this JSFiddle for working example.
—-
Bivek Singh,
Team CanvasJSJune 27, 2017 at 8:06 pm in reply to: Stacked bar chart index total not correct with mix of positive & negative valueu #15431Thank you for reporting this. We are looking into the issue and will get back to you at the earliest.
—-
Bivek Singh,
Team CanvasJSAfter changing the value, you’ll need to re-render the chart to observe the changes. You can also use set method to change different properties of the chart. Please, take a look at this jsFiddle.
—-
Bivek Singh,
Team CanvasJS