Login to Ask a Question or Reply
Forum Replies Created by Bivek Singh
-
You seem to using string for
Yvalue which should be number. Changing the Y value should work fine.—-
Bivek Singh,
Team CanvasJSWe tried but are unable to reproduce the issue at our end. Can you please let us know the version of CanvasJS that you’re using? Also, can you please mention your browser version along with OS?
You can also try disabling hardware acceleration in your browser and check if it makes any difference.—-
Bivek Singh,
Team CanvasJSJuly 26, 2017 at 7:55 pm in reply to: Canvas js time issue (unexpected behavior when time is HH:59:59 ) #15658Avinash,
We tried reproducing the issue at our end but failed to do so. Can you please create a jsFiddle representing the issue so that we can look into it and help you out?
—-
Bivek Singh,
Team CanvasJSHannah,
Pie and Doughnut chart doesn’t support auto placement of indexLabels. Thank you for pointing the mistake in our documentation. We have updated it now.
—-
Bivek Singh,
Team CanvasJSJuly 25, 2017 at 8:18 pm in reply to: Integration: Duplicate keys not allowed in strict mode. #15636Thank you for reporting this. We have fixed the issue and here is the internal build for you.
—-
Bivek Singh,
Team CanvasJSAnthony,
Thank you for the suggestion. We’ll consider this in future versions.
—-
Bivek Singh,
Team CanvasJSPlease take a look at this tutorial for fetching data from database. You can even download different samples from here for integrating with different languages.
For making your chart dynamic, you need to fetch your data from database iteratively. You can also check this jsFiddle for reference.
—-
Bivek Singh,
Team CanvasJSEmeric,
Yes, that’s correct.
—-
Bivek Singh,
Team CanvasJSAnthony,
By default, chart will render each time on calling set method. You need to pass
falseas third parameter in the set method which would prevent the re-render of chart and set it totrueon last call to set method which might improve the performance as there won’t be repeated chart rendering.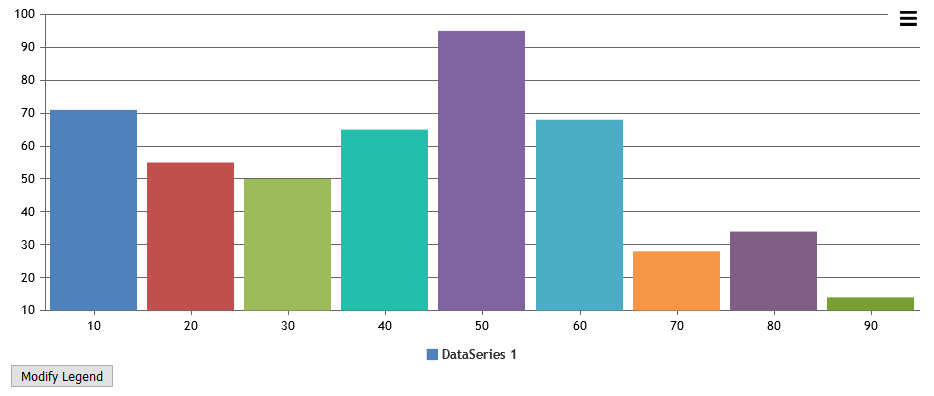
Bivek Singh,
Team CanvasJS@Hannah,
This is intended behavior. Some of the indexlabels are skipped to avoid overlapping. You can place indexLabels inside each section of pie using indexLabelPlacement.
Bivek Singh,
Team CanvasJSWe have introduced a new
destroymethod in v1.9.8.1 which solves this problem. For more details please take a look at this documentation page.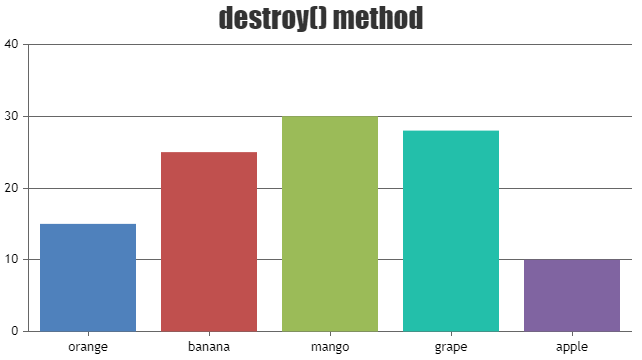
Bivek Singh,
Team CanvasJS@Hannah
We tried but couldn’t reproduce the issue at our end. Can you please create a jsFiddle so that we can look into the issue and help you out?
—-
Bivek Singh,
Team CanvasJSProviding user control for lineCap/lineJoin is on our roadMap but there is not a specific timeline for it yet. That was just a work-around which won’t work when animation is enabled.
—-
Bivek Singh,
Team CanvasJS