Login to Ask a Question or Reply
Forum Replies Created by Bivek Singh
-
Thank you for the suggestion. We will discuss this among the team and give it a thought. For now, you can use
e.entries[0].dataSeries._indexif you are not using shared tooltip.—–
Bivek Singh,
Team CanvasJSGustavo,
1- Why the parent div does not adjust to the canvas? (if I try other elements instead CanvasJS it works fine)
The height of canvas in CanvasJS Library is 400 pixels by default. That’s the reason it doesn’t adjust to it’s parent div even when you don’t provide height or width property.
2- As I removed the Title and moved the legend to the right, there is a huge gap now on the top and on the bottom of the Chart. Is there a way to remove it?
The gap also exists because of the same reason i.e. height of canvas. You can manually set the height of chartContainer. This will remove the extra gap on top and bottom of chart.
——
Bivek Singh,
Team CanvasJSYou can use convertPixelToValue method to fetch axis value for any given pixel co-ordinate. You can also get pixel co-ordinate for any axis value using convertValueToPixel.
—-
Bivek Singh,
Team CanvasJSNovember 30, 2017 at 10:37 am in reply to: chreate dynamic line chart for Temperature and time #17749Please download JSP samples from Download page. The sample also includes an example with date-time axis. You can run those examples in Eclipse locally.
——
Bivek Singh,
Team CanvasJSSometimes multiple values are represented by single pixel co-ordinate. This happens when the number of values on axis is greater than actual pixels available in given chart container. For example: If the height of the chart is 200px and the axis range is 0 to 1000. Each pixel co-ordinate will represent 5 axis value co-ordinates.
You can overcome this issue by rounding off the selected value as per your requirement. You can also take a look at this example which uses ySnapDistance to round off the pixel positions.
You can also re-adjust the height and width of the chart and see if it makes any changes.—-
Bivek Singh,
Team CanvasSJShared tooltip works for dataPoints sharing the same X values by default. You can use entries of contentFormatter to modify the tooltip as per your requirements. Entries contains all the dataSeries and dataPoints which can be used to find the nearest value and show it in toolTip.
—–
Bivek Singh,
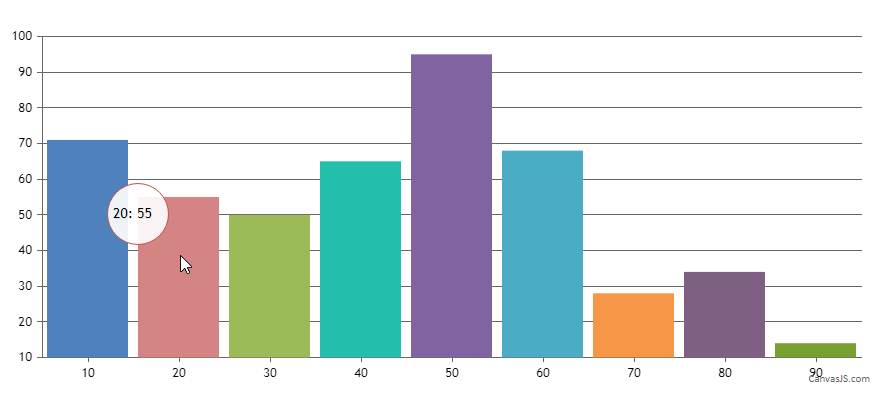
Team canvasJSYou can customize tooltip as per your requirement by modifying styles of
canvasjs-chart-tooltipclass.
Kindly take a look at the code snippet below,.canvasjs-chart-tooltip div{ border-radius : 50% !important; width : 50px !important; height : 50px !important; } .canvasjs-chart-tooltip { box-shadow : rgba(0, 0, 0, 0) 1px 1px 2px 2px !important }Please take a look at this JSFiddle for an example on creating custom Tooltip styles using CSS.
—–
Bivek Singh,
Team CanvasJSThis can be done using CanvasJS as well. Please take a look at indexLabels.
—-
Bivek Singh,
Team CanvasJSNovember 13, 2017 at 7:55 pm in reply to: Setting legend.itemWidth restricts each data series by more and more #17546We have fixed this issue. Here is an internal build for you. Please download the fixed version and let us know your feedback.
—–
Bivek Singh,
Team CanvasJSSorry, this feature is not available as of now. However you can take a look at this example in gallery, which is something similar.
—–
Bivek Singh,
Team CanvasJSIt is not possible to have multiple tooltip contentFormatter for different dataSeries. However, You can use xValueFormatString and yValueFormatString to format x-values and y-values that appear in toolTip or IndexLabel. For more customization, you can use toolTipContnet in dataSeries level to format and modify the toolTip content
—–
Bivek Singh,
Team CanvasJSDhiraj,
When the number of dataPoints are more, the interval is calculated such that axis labels won’t overlap. You can use interval to control interval value and show label for each dataPoint.
—-
Bivek Singh,
Team CanvasJS