Home Forums Chart Support Hover effect – vertical line over datapoint

Hover effect – vertical line over datapoint

Viewing 3 posts - 1 through 3 (of 3 total)
  • #15438

    Hello,

    Just got license. Like the library and documentation very much. We would like to create a 1 pixel wide vertical stroke going from the top to the bottom of the canvas as a datapoint hover effect like so:

    hover effect

    My searches of your documentation and StackOverflow have not come up with anything close. Is it possible in CanvasJS?

    Thank you,

    • This topic was modified 6 years, 10 months ago by Kathy. Reason: corrected img path
    #15440

    @mhoward1,

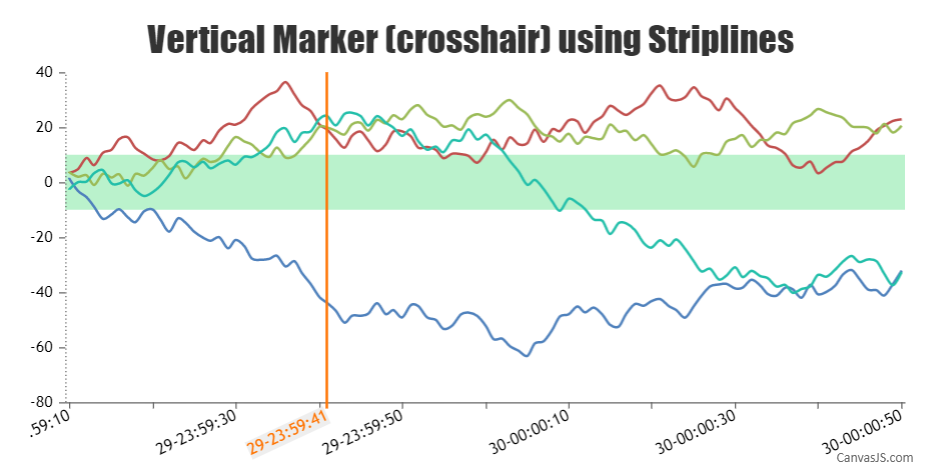
    You can add stripLine for drawing a vertical line along axisX as shown in the code snippet below –

    function stripLineHandler(position){
      if(!chart.options.axisX){
        chart.options.axisX ={};
      }
      if(!chart.options.axisX.stripLines){
        chart.options.axisX.stripLines = [];
      }
      chart.options.axisX.stripLines[0] = {
        value : position,
        thickness: 2,
        //color:"red",
        showOnTop: true,
        label: (new Date(position).getDate()+"-"+new Date(position).getHours()+":"+new Date(position).getMinutes()+":"+new Date(position).getSeconds()),
        labelPlacement: "outside"
      }
      chart.render();
     }

    Please take a look at this JSFiddle for working example.

    StripLine based on mouse pointer position

    —-
    Bivek Singh,
    Team CanvasJS

    #15444

    Thank you!!

Viewing 3 posts - 1 through 3 (of 3 total)

You must be logged in to reply to this topic.