Login to Ask a Question or Reply
You must be logged in to post your query.
Home › Forums › Chart Support › Get coordinates of a point
Get coordinates of a point
- This topic has 13 replies, 4 voices, and was last updated 7 years, 7 months ago by
Sanjoy.
-
June 23, 2017 at 4:33 pm #15395
Hello,
I know it’s possible to get coordinates of markers using it: chart.axisX[0].stripLines[0].get(“bounds”).x1
But is it possible to get coordinates of points in my graph ?Thank you in advance !
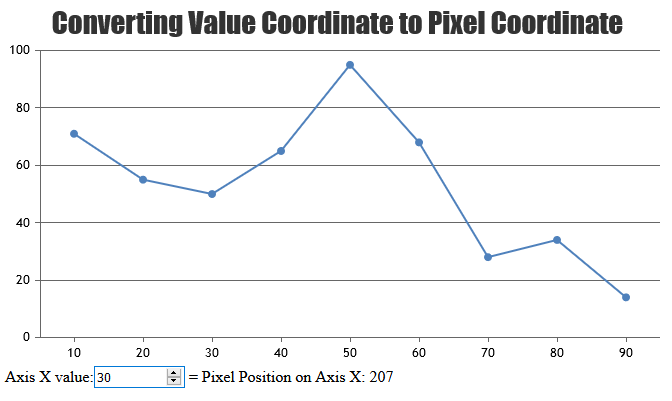
June 26, 2017 at 10:27 am #15410To know pixel coordinate of a dataPoint you can use convertValueToPixel method.

—
Sanjoy Debnath
Team CanvasJSJune 27, 2017 at 6:52 pm #15429Thank you !
And is it possible to create a stripLine dynamically ?
For example I have a graph and when I click on a button, it will add a new StripLine.Same question for grid, is it possible ?
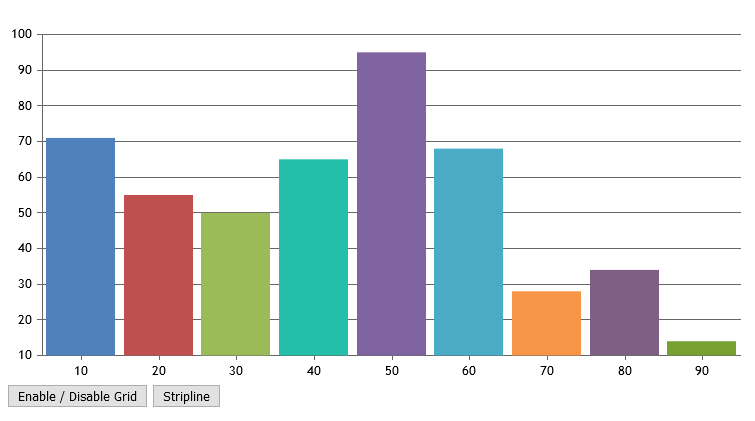
June 27, 2017 at 7:24 pm #15430Example for the grid: When I click on a button, the grid appears/disappears
June 27, 2017 at 9:24 pm #15433June 28, 2017 at 12:45 pm #15441Amazing, thank you a lot !
July 20, 2017 at 8:27 pm #15613Hello,
I have another question about coordinates:
Is it possible to get coordinates of axis X and Y ?If I understood convertValueToPixel right, I have for example this data: [[0,12],[10,66],[20,42]]
And in order to get coordinates of [10,66], I need to write:
chart.axisX[0].convertValueToPixel(10) and chart.axisY[0].convertValueToPixel(66) ? Is that correct ?Then if that’s right I just have to write chart.axisX[0].convertValueToPixel(0) and chart.axisY[0].convertValueToPixel(0) to get the coordinate of axis X?
Thank you.
Regards.
July 21, 2017 at 11:02 am #15615Emeric,
Yes, that’s correct.
—-
Bivek Singh,
Team CanvasJSNovember 10, 2017 at 3:51 pm #17518Hello,
Is there any way to get co-ordinates of intersecting lines atx and y axis in mutliline spline chart?-
This reply was modified 7 years, 7 months ago by
jigisha.
November 10, 2017 at 7:48 pm #17524Jigisha,
Sorry, this feature is not available as of now.
—
Sanjoy Debnath,
Team CanvasJSNovember 10, 2017 at 9:05 pm #17525Thanks for the reply….
Than any of the graph tool available or you know which provides this? or do you have any idea how to achieve this?Please let me know its very important for me to do ASAP.
Thank you
JigishaNovember 13, 2017 at 4:45 pm #17544Jigisa,
You can find out the intersection points of the curves by solving the original equations of the curves intersecting each other. This will give you accurate result.
Many curve can pass through finite number of discontinuous dataPoints. CanvasJS uses approximate Bézier curve interpolation, to represent the curve passing through user given dataPoints. So, it’s almost impossible to construct an unique equation passing through the sample dataPoints and find intersection between two spline curve.
However, there is a workaround using Image processing and convertPixelToValue method (given in API). But this will only give you an approximate Intersecting coordinate of the curves.
—
Sanjoy Debnath
Team CanvasJS -
This reply was modified 7 years, 7 months ago by
You must be logged in to reply to this topic.
