CanvasJS Chart v3.4.6 & StockChart v1.4.6 GA Released
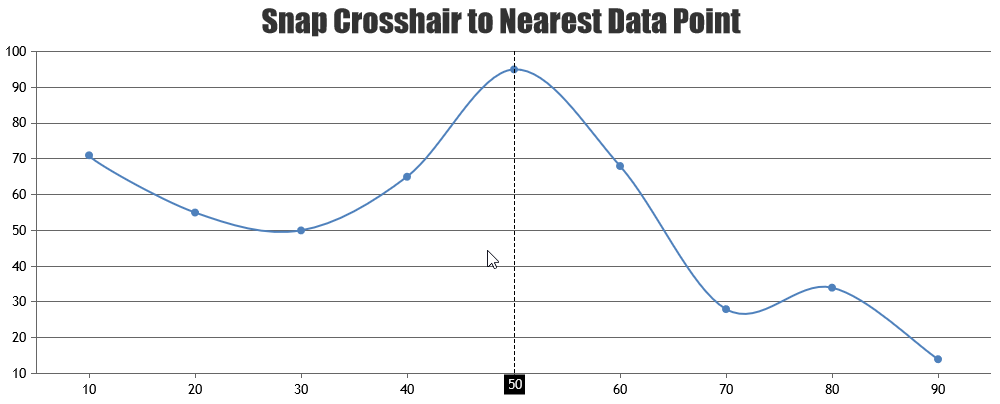
Today we are releasing CanvasJS Chart v3.4.6 & StockChart v1.4.6 GA with a few bug fixes. Below is a summary of this release. Release Update (Chart & StockChart) Bug Fixes In some cases, crosshair value returned in event parameter of labelFormatter was not proper, when snapToDataPoint was set to true. In some cases,
CanvasJS Chart v3.4.5 & StockChart v1.4.5 GA Released
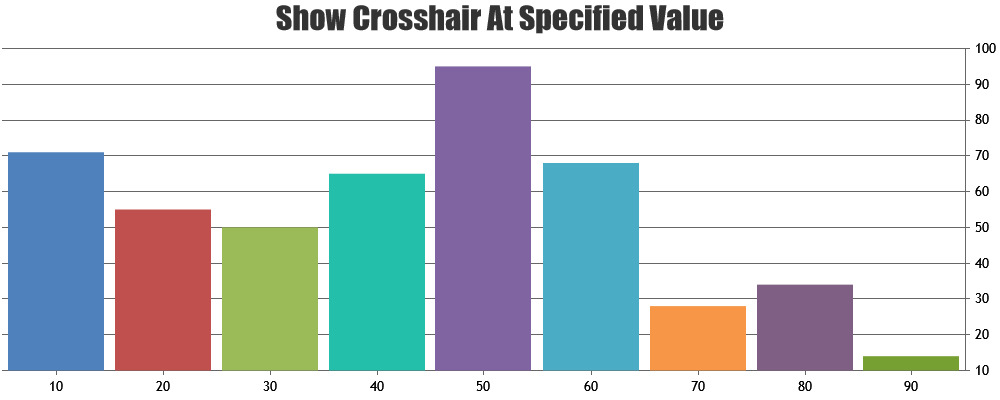
Today we are releasing CanvasJS Chart v3.4.5 & StockChart v1.4.5 GA with a few bug fixes. Below is a summary of this release. Release Update (Chart & StockChart) Bug Fixes In some cases, showAt method of crosshair was not working in secondary y-axis (axisY2). We thank rlong for reporting this bug.
CanvasJS Chart v3.4.4 & StockChart v1.4.4 GA Released
Today we are releasing CanvasJS Chart v3.4.4 & StockChart v1.4.4 GA with a few bug fixes. Below is a summary of this release. Release Update (Chart & StockChart) Bug Fixes In some cases, tooltip updated & hidden events were getting fired even when tooltip was disabled. Do download the latest version from
CanvasJS Chart v3.4.3 & StockChart v1.4.3 GA Released
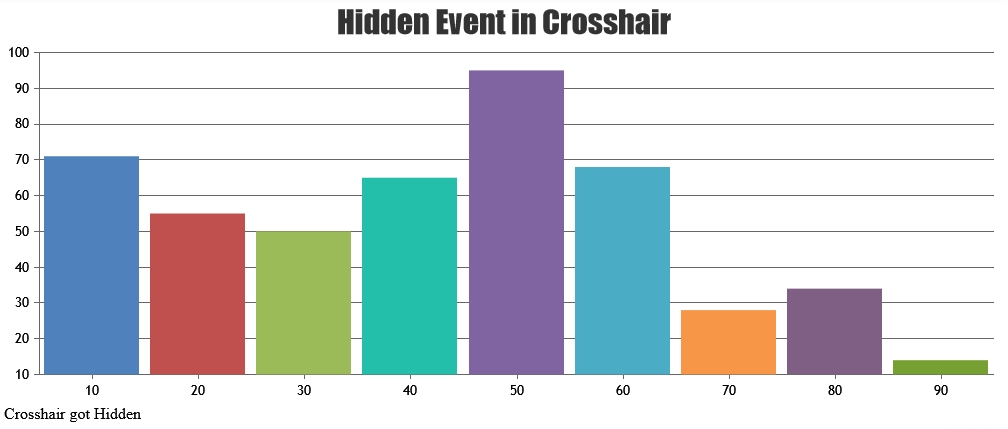
Today we are releasing CanvasJS Chart v3.4.3 & StockChart v1.4.3 GA with a few bug fixes. Below is a summary of this release. Release Update (Chart & StockChart) Bug Fixes In some cases, crosshair hidden event was not getting fired even when crosshair was getting hidden. Do download the latest version from
CanvasJS Chart v3.4.2 & StockChart v1.4.2 GA Released
Today we are releasing CanvasJS Chart v3.4.2 & StockChart v1.4.2 GA with a few bug fixes. Below is a summary of this release. Release Update (Chart & StockChart) Bug Fixes Error was being thrown in some cases of multiple axes when axis labels were placed inside. Do download the latest version from
CanvasJS Chart v3.4.1 & StockChart v1.4.1 GA Released
Today we are releasing CanvasJS Chart v3.4.1 & StockChart v1.4.1 GA with a few bug fixes. Below is a summary of this release. Release Update (Chart & StockChart) Bug Fixes In some cases, culture of toolbar elements was not getting applied on updating it dynamically. Do download the latest version from our
CanvasJS Chart v3.4 & StockChart v1.4 GA Released
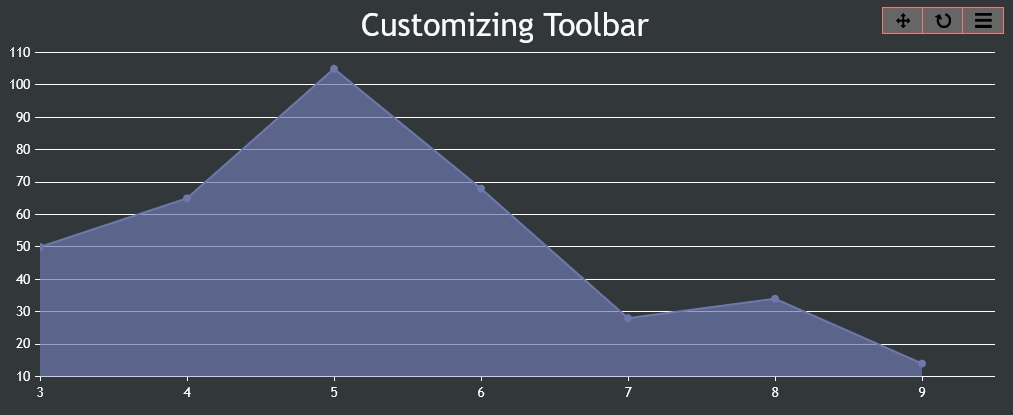
Today we are releasing CanvasJS Chart v3.4 & StockChart v1.4 GA with a few features & a few bug fixes. Below is a summary of this release. Release Update (Chart & StockChart) New Features & Enhancement toolbar – lets you customize look & feel of toolbar options (zoom/pan button, reset button, export-menu &
CanvasJS Chart v3.4 & StockChart v1.4 Beta 1 Released
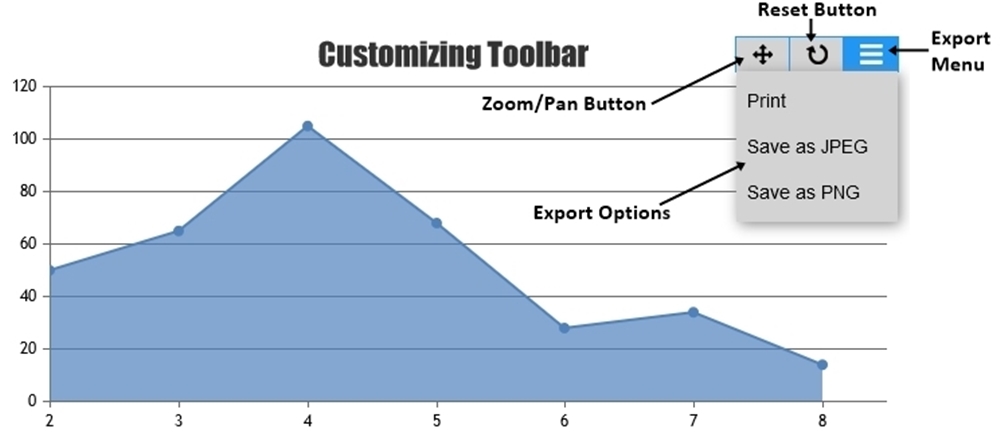
Today we are releasing CanvasJS Chart v3.4 & StockChart v1.4 Beta 1 with a few features. Below is a summary of this release. Release Update (Chart & StockChart) New Features & Enhancement toolbar object – lets you customize look & feel of toolbar options (zoom/pan button, reset button, export-menu & export-options). itemBackgroundColor –
CanvasJS StockChart v1.3.5 GA Released
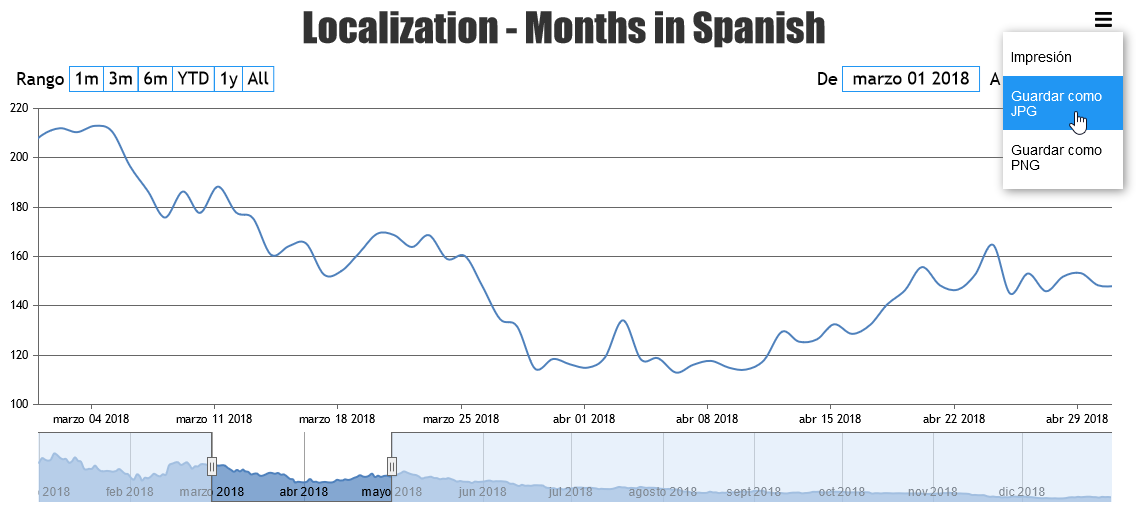
Today we are releasing CanvasJS StockChart v1.3.5 GA with a few bug fixes. Below is a summary of this release. Release Update Bug Fixes Label was not getting removed when range-buttons were removed dynamically. Do download the latest version from our download page and let us know your feedback. Thank You, Vishwas
CanvasJS StockChart v1.3.4 GA Released
Today we are releasing CanvasJS StockChart v1.3.4 GA with a few bug fixes. Below is a summary of this release. Release Update Bug Fixes Error was being thrown in some cases when range-buttons were disabled. Do download the latest version from our download page and let us know your feedback. Thank You,