CanvasJS Chart v3.14.0 & StockChart v1.14.0 GA Released
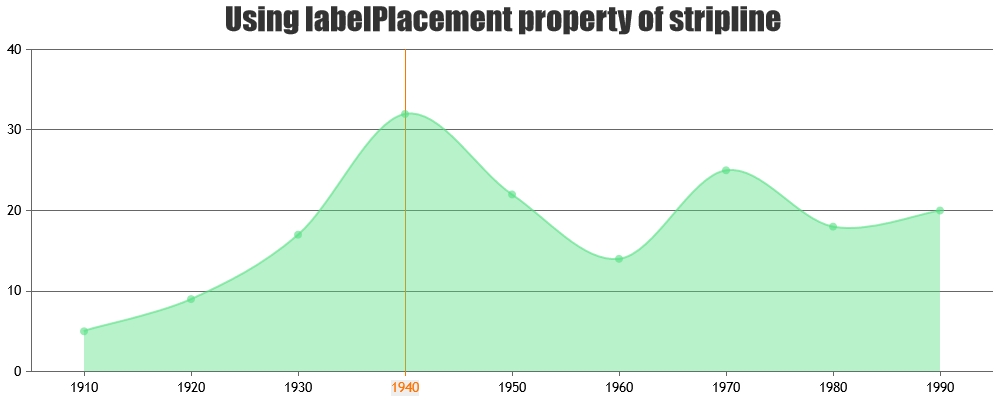
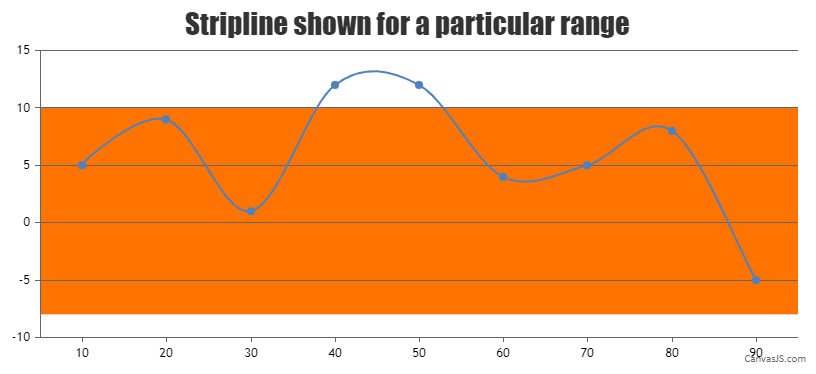
Today, we are releasing CanvasJS Chart v3.14.0 & StockChart v1.14.0 GA, which include features related to stripline ticks along with a few bug fixes. Below is a summary of this release. Chart Release Update Features & Improvements Added tickLength property to striplines that allows you to adjust the length of ticks when
CanvasJS Chart v3.14.0 & StockChart v1.14.0 Beta 1 Released
Today, we are releasing CanvasJS Chart v3.14.0 & StockChart v1.14.0 Beta 1, which include features related to stripline ticks along with a few bug fixes. Below is a summary of this release. Chart Release Update Features & Improvements Added tickLength property to striplines that allows you to adjust the length of ticks
CanvasJS Chart v3.13.9 & StockChart v1.13.9 GA Released
Today, we are releasing CanvasJS Chart v3.13.9 & StockChart v1.13.9 GA, which include a few bug fixes related to doughnut chart, highlighting datapoint and resetting the range in stockchart. Below is a summary of this release. Chart Release Update Improvements In some cases, the lineDashType of the crosshair was affecting the dash-type
CanvasJS Chart v3.13.8 & StockChart v1.13.8 GA Released
Today, we are releasing CanvasJS Chart v3.13.8 & StockChart v1.13.8 GA, which include a few improvements & bug fixes related to crosshair label and range buttons. Below is a summary of this release. Chart Release Update Improvements Improved the auto-calculated valueFormatString in crosshair to display decimal points as per datapoint value when
CanvasJS Chart v3.13.7 & StockChart v1.13.7 GA Released
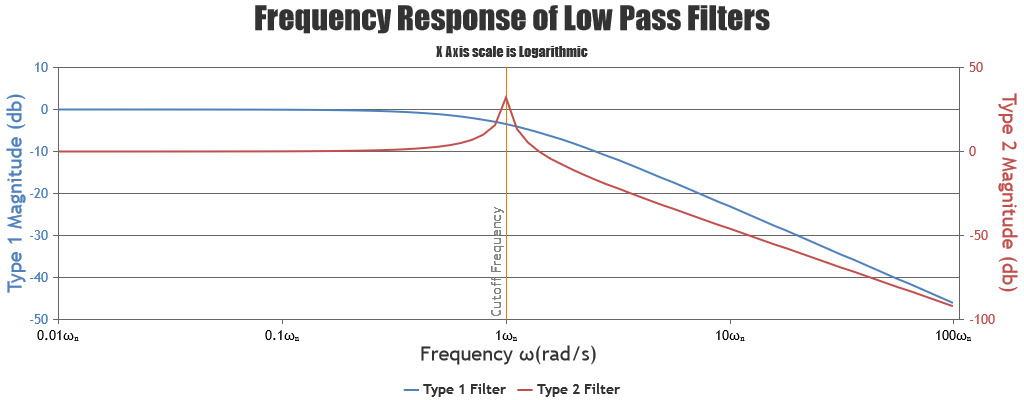
Today, we are releasing CanvasJS Chart v3.13.7 & StockChart v1.13.7 GA, which include a few bug fixes related to logarithmic axis, stacked area 100% chart and range buttons. Below is a summary of this release. Chart Release Update Bug Fixes Chart was not rendering and was freezing the browser in certain cases
CanvasJS StockChart v1.13.6 GA Released

Today we are releasing CanvasJS StockChart v1.13.6 GA with a few bug fixes related to range buttons and slider. Below is a summary of this release. StockChart Release Update Bug Fixes selectedRangeButtonIndex was not working properly when endValue or slider maximum was set after initial render. In some cases of dynamic charts,
CanvasJS Chart v3.13.5 & StockChart v1.13.5 GA Released
Today, we are releasing CanvasJS Chart v3.13.5 & StockChart v1.13.5 GA, which include a few bug fixes related to tooltip and rangebuttons. Below is a summary of this release. Chart Release Update Bug Fixes In some cases with smaller y-values, the tooltip displayed ‘0’ instead of the correct value when there were
CanvasJS Chart v3.13.4 & StockChart v1.13.4 GA Released
Today, we are releasing CanvasJS Chart v3.13.4 & StockChart v1.13.4 GA, which include a few bug fixes related to datapoint highlighting and range buttons. Below is a summary of this release. Chart Release Update Bug Fixes In some cases, datapoints were getting highlighted while panning, when the tooltip was disabled. StockChart
CanvasJS Chart v3.13.3 & StockChart v1.13.3 GA Released
Today, we are releasing CanvasJS Chart v3.13.3 & StockChart v1.13.3 GA, which include a few bug fixes related to crosshair and range in StockChart. Below is a summary of this release. Chart Release Update Bug Fixes In some cases, crosshair wasn’t rendering when the mouse was dragged outside the plot area and
CanvasJS Chart v3.13.2 & StockChart v1.13.2 GA Released
Today, we are releasing CanvasJS Chart v3.13.2 & StockChart v1.13.2 GA, which include a few bug fixes related to axis striplines and bar chart. Below is a summary of this release. Chart Release Update Bug Fixes In some cases, stripline with range was not positioned properly when it was partially inside a