CanvasJS Chart v3.15.15 & StockChart v1.15.15 GA Released
Today, we are releasing CanvasJS Chart v3.15.15 & StockChart v1.15.15 GA, which include performance optimization & a few bug fixes related to slider. Below is a summary of this release. Chart Release Update Bug Fixes Optimized rendering performance for multi-series charts with large datasets, resolving a recent regression affecting line, area, column,
CanvasJS Chart v3.15.14 & StockChart v1.15.14 GA Released
Today, we are releasing CanvasJS Chart v3.15.14 & StockChart v1.15.14 GA, which include a few bug fixes related to axis viewport. Below is a summary of this release. Chart & StockChart Release Update Bug Fixes In some cases where datetime axis is used, the browser was freezing when viewportMinimum of axis was
CanvasJS StockChart v1.15.13 GA Released

Today, we are releasing CanvasJS StockChart v1.15.13 GA, which includes a few bug fixes related to slider. Below is a summary of this release. StockChart Release Update Bug Fixes The slider maximum was not updating correctly when the slider was dragged to the right extreme, when dynamicUpdate was set to false.
CanvasJS Chart v3.15.12 & StockChart v1.15.12 GA Released
Today, we are releasing CanvasJS Chart v3.15.12 & StockChart v1.15.12 GA, which include a few bug fixes related to Column, Bar & Stacked Charts. Below is a summary of this release. Chart & StockChart Release Update Bug Fixes In some cases, the dataPointWidth & dataPointMaxWidth in multi-series column and bar charts with
CanvasJS StockChart v1.15.11 GA Released
Today, we are releasing CanvasJS StockChart v1.15.11 GA, which includes a few bug fixes related to navigator range. Below is a summary of this release. StockChart Release Update Bug Fixes In some cases, the Navigator slider was not synchronizing the axis range and inputFields when moved beyond the maximum set in the
CanvasJS StockChart v1.15.10 GA Released
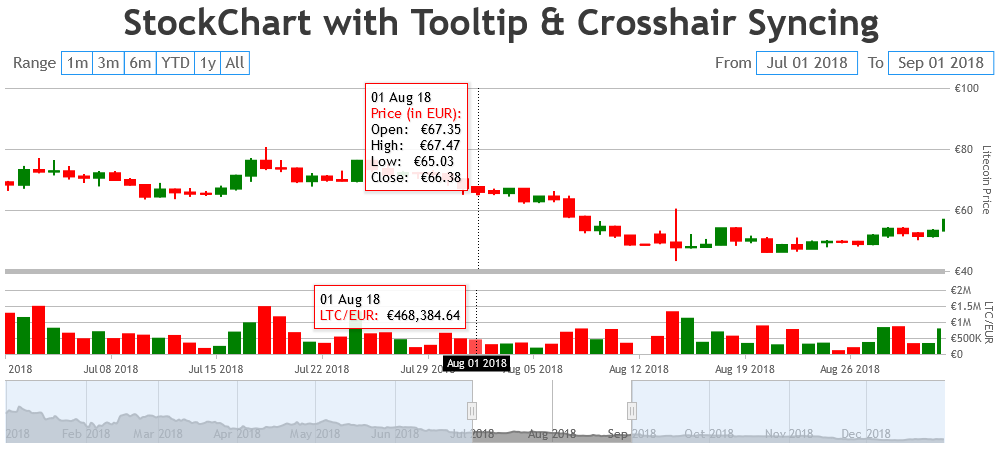
Today, we are releasing CanvasJS StockChart v1.15.10 GA, which include a few bug fixes related to Charts alignment in StockChart. Below is a summary of this release. StockChart Release Update Bug Fixes In some cases of multiple charts, the charts weren’t aligning correctly. As a result, tooltips and crosshairs appeared out of
CanvasJS Chart v3.15.9 & StockChart v1.15.9 GA Released
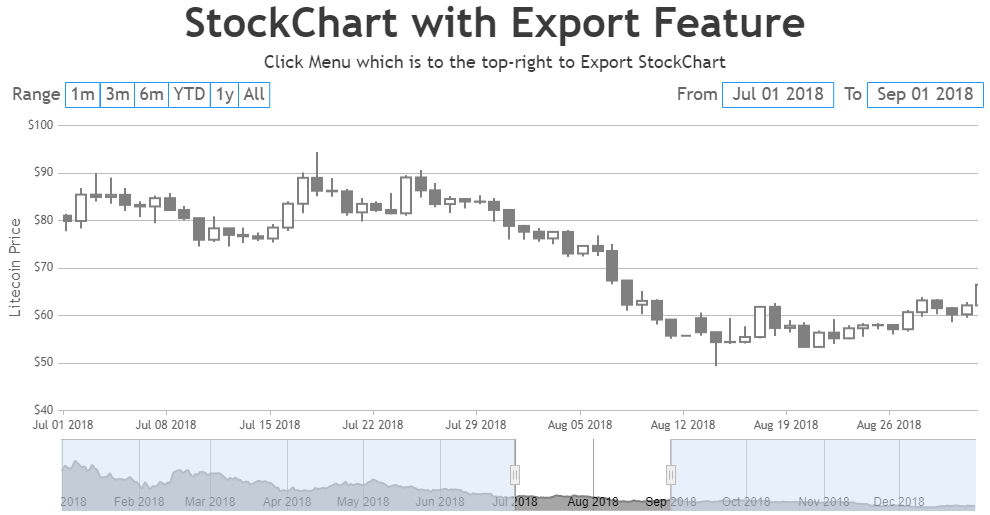
Today, we are releasing CanvasJS Chart v3.15.9 & StockChart v1.15.9 GA, which include a few bug fixes related to export menu. Below is a summary of this release. Chart & StockChart Release Update Bug Fixes When the export menu of the StockChart was opened, clicking anywhere on the individual chart did not
CanvasJS Chart v3.15.8 & StockChart v1.15.8 GA Released
Today, we are releasing CanvasJS Chart v3.15.8 & StockChart v1.15.8 GA, which include a few bug fixes related to zoom, reset & export buttons. Below is a summary of this release. Chart & StockChart Release Update Bug Fixes In some cases of dynamic charts, export button was being shown before zoom &
CanvasJS Chart v3.15.7 & StockChart v1.15.7 GA Released
Today, we are releasing CanvasJS Chart v3.15.7 & StockChart v1.15.7 GA, which include a few bug fixes related to funnel, pyramid, pie and doughnut charts. Below is a summary of this release. Chart & StockChart Release Update Bug Fixes In some cases, the entire funnel/pyramid shifted to the left when indexlabels were
CanvasJS Chart v3.15.6 & StockChart v1.15.6 GA Released
Today, we are releasing CanvasJS Chart v3.15.6 & StockChart v1.15.6 GA, which include a few bug fixes related to funnel and pyramid charts. Below is a summary of this release. Chart & StockChart Release Update Bug Fixes When indexLabelFormatter returned an empty string, the entire funnel/pyramid shifted to the left, as space