CanvasJS Chart v3.2.18 & StockChart v1.2.18 GA Released
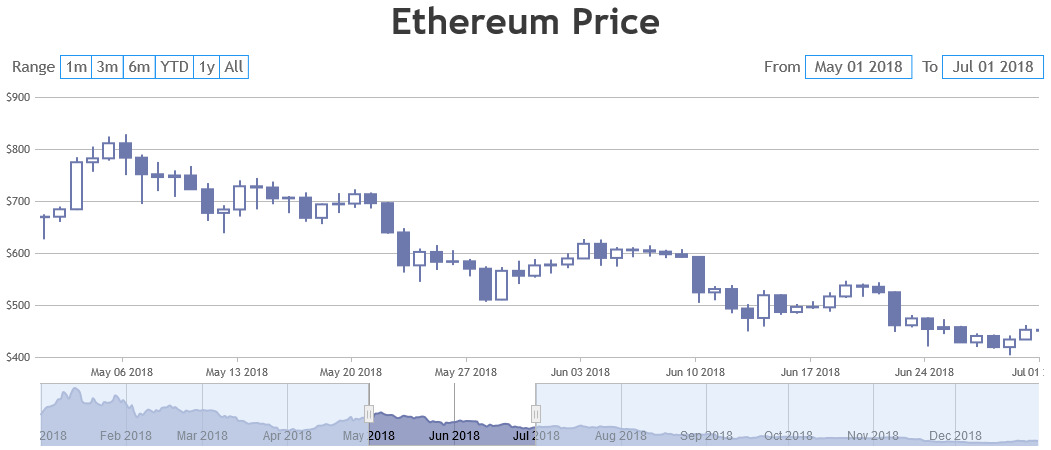
Today we are releasing CanvasJS Chart v3.2.18 & StockChart v1.2.18 GA with a few bug fixes. Below is a summary of this release. Release Update (Chart & StockChart) Bug Fixes In some cases of date-time axis, setting viewportMinimum & viewportMaximum was not working. We thank Joseph Simonds for reporting this bug.
CanvasJS Chart v3.2.17 & StockChart v1.2.17 GA Released
Today we are releasing CanvasJS Chart v3.2.17 & StockChart v1.2.17 GA with a few bug fixes. Below is a summary of this release. Release Update (Chart & StockChart) Bug Fixes In some cases, axis labels were not getting positioned properly when labelPlacement was set to inside. Do download the latest version from
CanvasJS Chart v3.2.16 & StockChart v1.2.16 GA Released
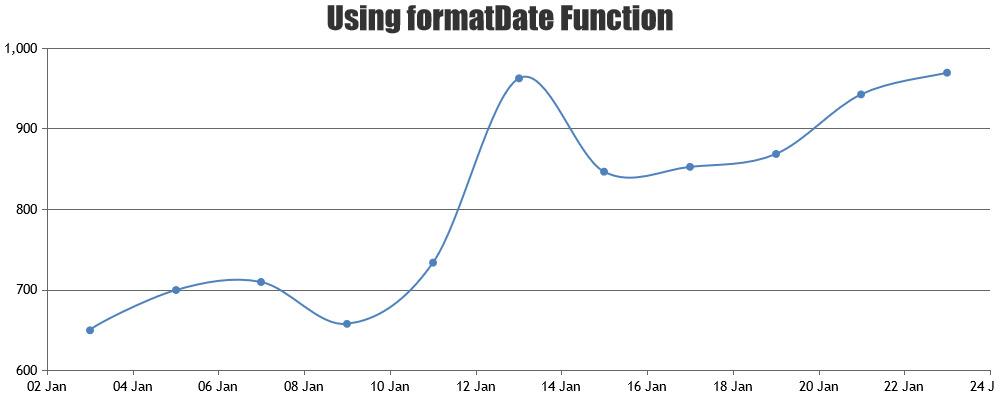
Today we are releasing CanvasJS Chart v3.2.16 & StockChart v1.2.16 GA with a few bug fixes. Below is a summary of this release. Release Update (Chart & StockChart) Bug Fixes In some cases, formatDate method was not returning milliseconds according to valueFormatString passed to it. We thank Festo AG & Co. KG
CanvasJS Chart v3.2.15 & StockChart v1.2.15 GA Released
Today we are releasing CanvasJS Chart v3.2.15 & StockChart v1.2.15 GA with a few bug fixes. Below is a summary of this release. Release Update (Chart & StockChart) Bug Fixes In some cases, axis labels were not being shown. This used to happen with some combinations of labelAutoFit, labelMaxWidth, labelWrap & labelAngle properties.
CanvasJS StockChart v1.2.14 GA Released
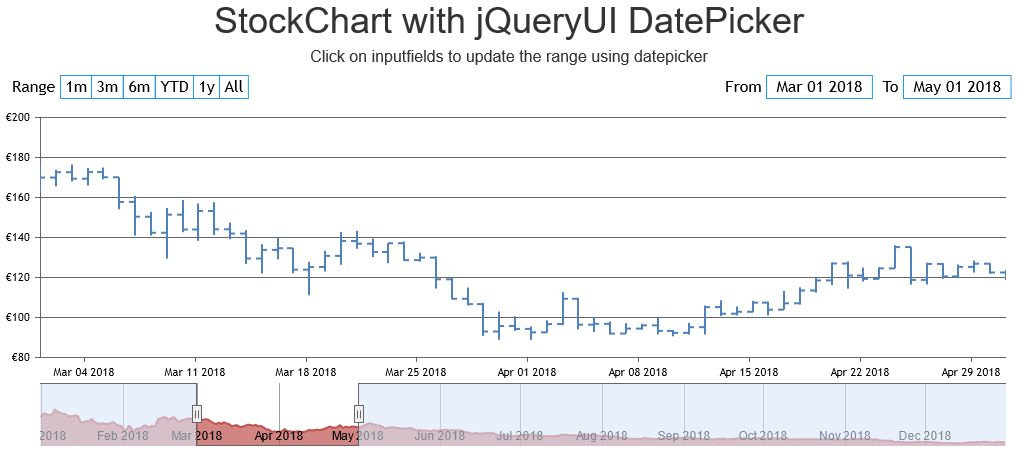
Today we are releasing CanvasJS StockChart v1.2.14 GA with a few bug fixes. Below is a summary of this release. Release Update Bug Fixes In some cases, inputfields were not getting positioned properly. Do download the latest version from our download page and let us know your feedback. Thank You, Vishwas R
CanvasJS Chart v3.2.13 & StockChart v1.2.13 GA Released
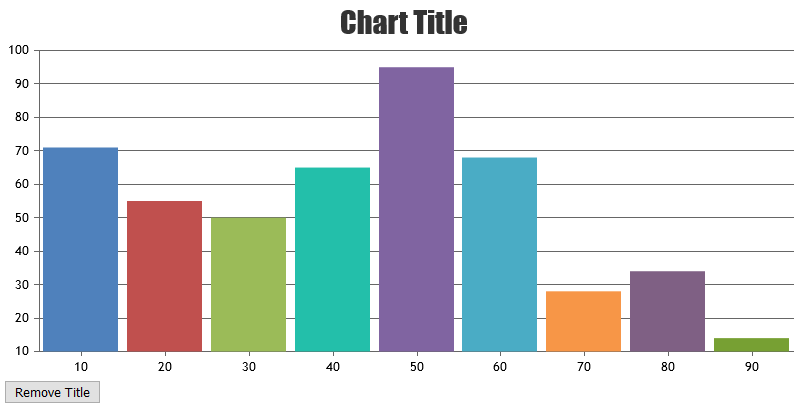
Today we are releasing CanvasJS Chart v3.2.13 & StockChart v1.2.13 GA with a few bug fixes. Below is a summary of this release. Release Update (Chart & StockChart) Bug Fixes Remove method was not working in Chart & StockChart title. Do download the latest version from our download page and let us
CanvasJS Chart v3.2.12 & StockChart v1.2.12 GA Released
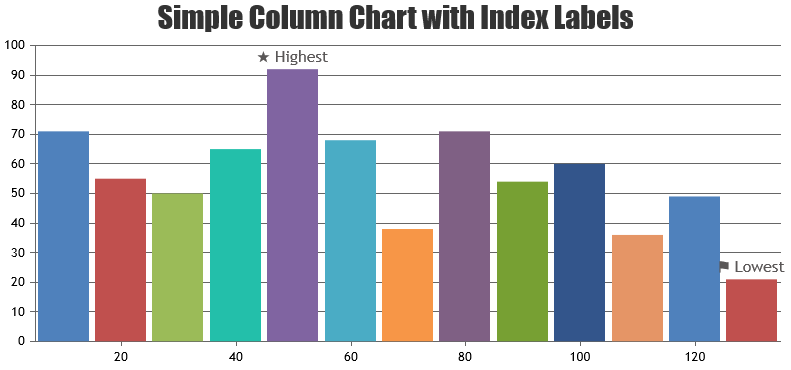
Today we are releasing CanvasJS Chart v3.2.12 & StockChart v1.2.12 GA with a few bug fixes. Below is a summary of this release. Release Update (Chart & StockChart) Bug Fixes In some cases, indexlabel was partially getting inside column when it is wrapped & even though space is available outside. We thank
CanvasJS Chart v3.2.11 & StockChart v1.2.11 GA Released
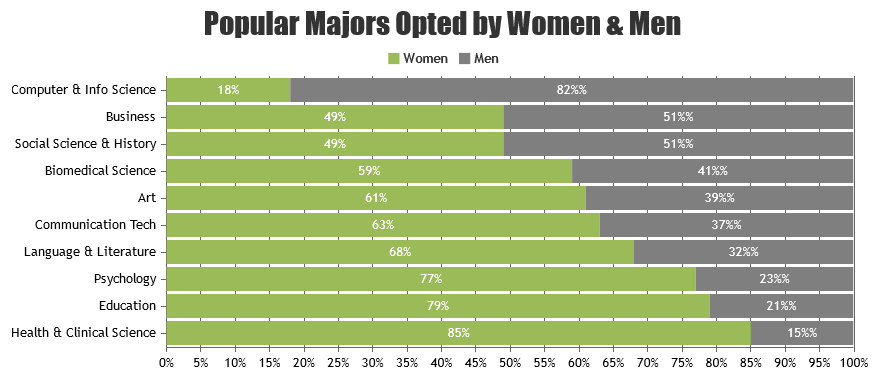
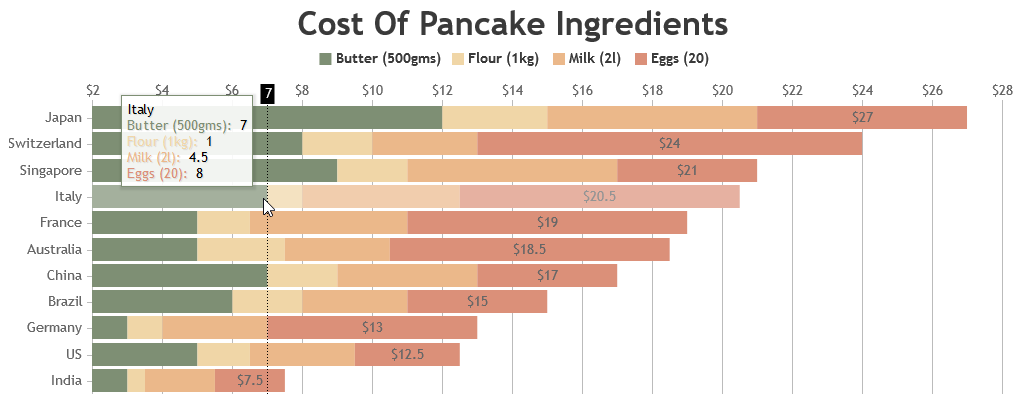
Today we are releasing CanvasJS Chart v3.2.11 & StockChart v1.2.11 GA with a few bug fixes. Below is a summary of this release. Release Update (Chart & StockChart) Bug Fixes In some cases of stacked charts, formatting percentage value in tooltip & indexlabel was freezing the browser. We thank Anastasia Ortmann &
CanvasJS StockChart v1.2.10 GA Released
Today we are releasing CanvasJS StockChart v1.2.10 GA with a few bug fixes. Below is a summary of this release. Release Update Bug Fixes In some cases when navigator was disabled, range was not getting updated on changing inputfields value. Do download the latest version from our download page and let us
CanvasJS Chart v3.2.9 & StockChart v1.2.9 GA Released
Today we are releasing CanvasJS Chart v3.2.9 & StockChart v1.2.9 GA with a new feature & few bug fixes. Below is a summary of this release. Release Update (Chart & StockChart) New Features & Enhancement selectedColorSet – lets you to get the colors present in selected colorSet of the Chart / StockChart.