CanvasJS Chart v3.7.26 & StockChart v1.7.26 GA Released
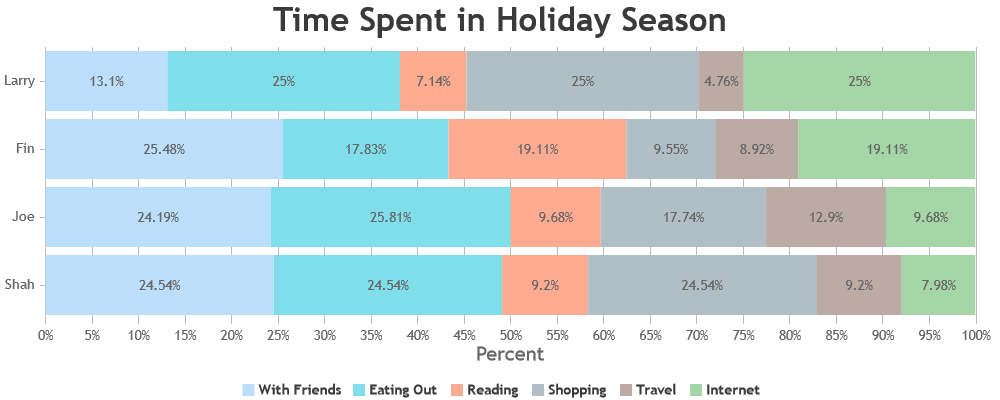
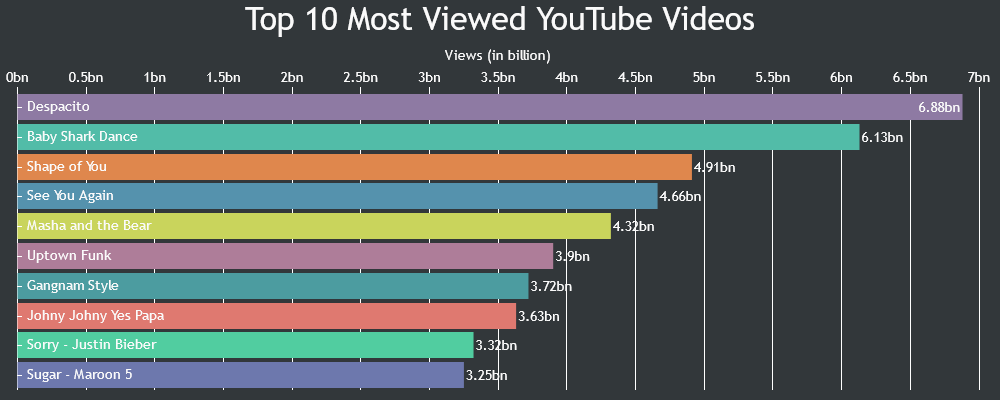
Today we are releasing CanvasJS Chart v3.7.26 & StockChart v1.7.26 GA with a few bug fixes related to bar charts. Below is a summary of this release. Release Update (Chart & StockChart) Bug Fixes In some cases of bar charts, y-axis title was overlapping y-axis labels, ticks and line while switching between zoom
CanvasJS Chart v3.7.25 & StockChart v1.7.25 GA Released
Today we are releasing CanvasJS Chart v3.7.25 & StockChart v1.7.25 GA with a few bug fixes related to bar charts. Below is a summary of this release. Release Update (Chart & StockChart) Bug Fixes In some cases of bar charts, datapoints were moving out of the plotarea and were overlapping x-axis elements.
CanvasJS Chart v3.7.24 & StockChart v1.7.24 GA Released
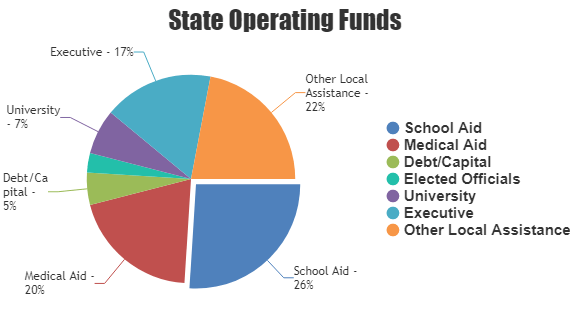
Today we are releasing CanvasJS Chart v3.7.24 & StockChart v1.7.24 GA with a few bug fixes related to pie & doughnut charts. Below is a summary of this release. Release Update (Chart & StockChart) Bug Fixes In Pie & Doughnut Charts, datapoints that were present after a null datapoint were not being highlighted
CanvasJS Chart v3.7.23 & StockChart v1.7.23 GA Released
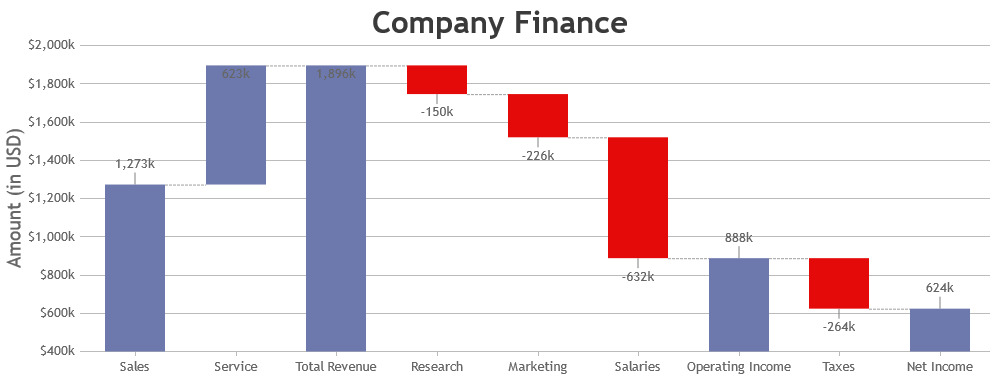
Today we are releasing CanvasJS Chart v3.7.23 & StockChart v1.7.23 GA with a few bug fixes related to indexlabels. Below is a summary of this release. Release Update (Chart & StockChart) Bug Fixes In some cases of waterfall chart, the indexlabel line was overlapping indexlabels. Do download the latest version from our
CanvasJS Chart v3.7.22 & StockChart v1.7.22 GA Released
Today we are releasing CanvasJS Chart v3.7.22 & StockChart v1.7.22 GA with a few bug fixes related to stripline labels. Below is a summary of this release. Release Update (Chart & StockChart) Bug Fixes In some cases of multiple axis, stripline label of one axis was overlapping the elements of other axis.
