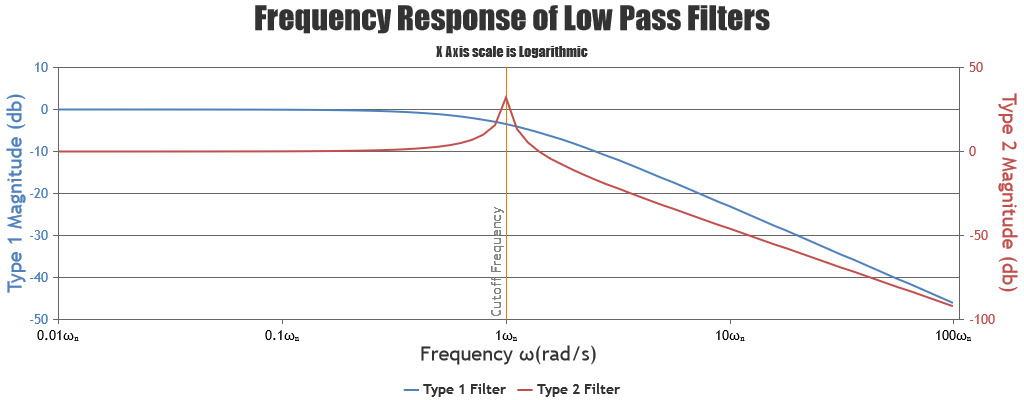
Today we are releasing CanvasJS Chart v3.2.3 & StockChart v1.2.3 GA with a few bug fixes. Below is a summary of this release.
Release Update (Chart & StockChart)
Bug Fixes
- Stripline labels were looking bold when they were positioned outside & showOnTop was set to true.
- In some cases of logarithmic axis, stripline with startValue & endValue was not rendering according to its value.
- In some cases, striplines were getting rendered outside the plotarea.
Thanks to manojkkuldeep and Ivan for reporting these bugs.
Do download the latest version from our download page and let us know your feedback.
Thank You,
Vishwas R
Team CanvasJS
3 Comments

Indeed, the issue is solved in theses case, but the issue remains when y-axis is logarithmic: striplines with startValue & endValue are not rendering according to their values.
Sorry you can delete my comment, I have canvasjs-stock-commercial-1.2.2, so the bug is still present.
Would it be possible to have the update to avoid this issue ?
Fabian,
The issue has been fixed in the StockChart v1.2.3 GA. Please download the latest version from My Account Page.
___________
Indranil Deo
Team CanvasJS