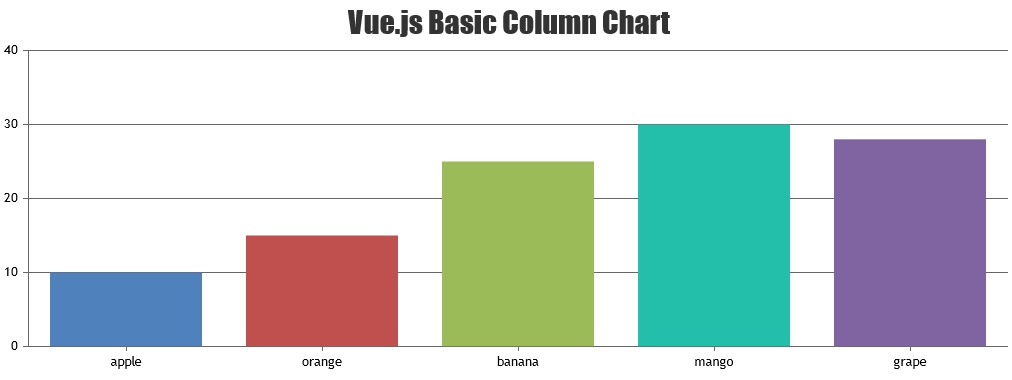
Today we are excited to release the most awaited Vue.js Component for CanvasJS Chart. Till now the charts used to work fine with Vue.js but didn’t have a component. But, given the popularity of Vue.js, we thought of implementing the same. So, if you are Vue.js Developer, you should feel at-home while using CanvasJS. Below is a summary of this release.
Release Update
Vue.js Component for CanvasJS Charts!
It’s time to use CanvasJS Charts the Vue.js way in your applications & dashboards. Now you can easily import CanvasJS Chart Component to your Vue.js application and make your data visualization simple & beautiful! Component supports Vue.js v2 & above.
Check out our Vue.js Charts Gallery for examples along with source code. We would be adding more examples in coming days.
Do download the latest version from our download page and let us know your feedback.
Thank You,
Vishwas R
Team CanvasJS

Leave a Reply