Today, we are releasing CanvasJS Chart v3.13.7 & StockChart v1.13.7 GA, which include a few bug fixes related to logarithmic axis, stacked area 100% chart and range buttons. Below is a summary of this release.
Chart Release Update
Bug Fixes
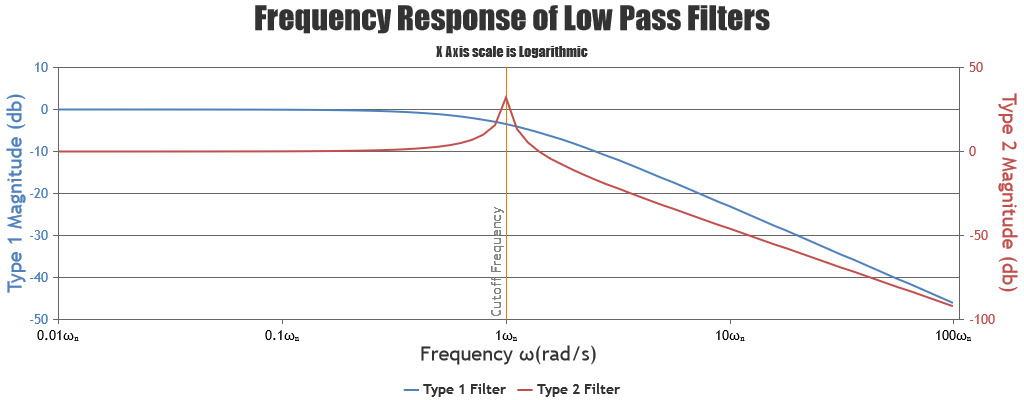
- Chart was not rendering and was freezing the browser in certain cases when using a logarithmic axis with small intervals – across axisX, axisX2, axisY & axisY2 with numeric values.
- In some cases of Stacked Area 100% charts, the line between datapoints appeared incorrectly when a null value existed between them.
StockChart Release Update
Bug Fixes
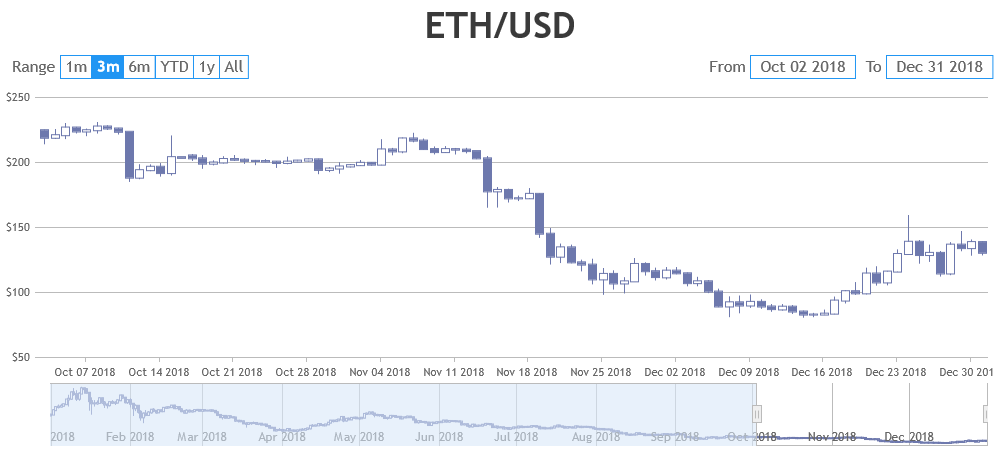
- In some cases, the YTD button was being incorrectly highlighted on re-render.
- The width of the selected range-button was incorrect on clicking the Reset button.
- In some cases, an error was thrown when the navigator was disabled and selectedRangeButtonIndex was set.
Do download the latest version from our download page and let us know your feedback.
Thank You,
Vishwas R
Team CanvasJS
Leave a Reply