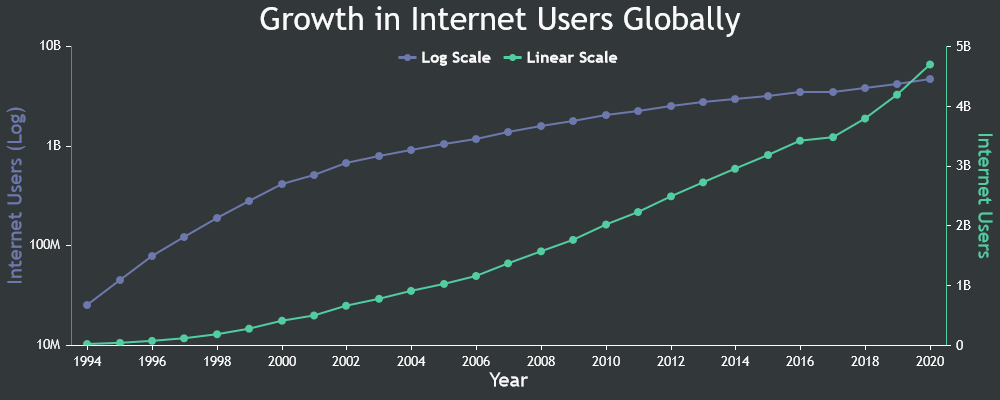
Today we are releasing CanvasJS Chart v3.7.8 & StockChart v1.7.8 GA with a few bug fixes related to tooltip and crosshair. Below is a summary of this release.
Release Update (Chart & StockChart)
Bug Fixes
- In some cases of logarithmic x-axis, tooltip was showing x-value as ‘undefined’.
- In some cases of logarithmic x-axis, crosshair label was showing valueFormatString instead of value.
- In Box & Whisker chart, y-values (Minimum, Q1, Q2, Q3, Maximum) shown in tooltip were not aligned properly.
Do download the latest version from our download page and let us know your feedback.
Thank You,
Vishwas R
Team CanvasJS

Leave a Reply