CanvasJS v2.0 Beta-2 Released
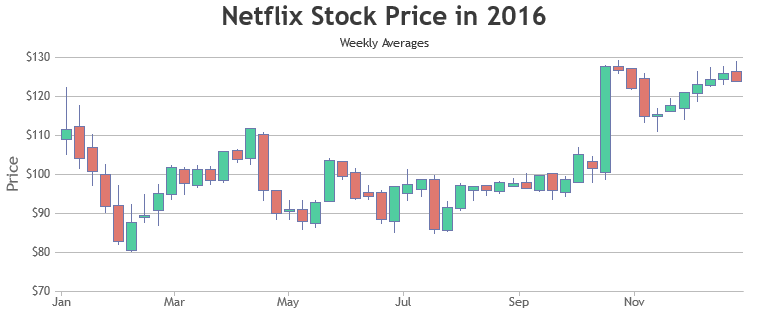
Today we are releasing v2.0 Beta 2 with some new features, improvements and bug fixes. Below is a summary of this release. New Features & Enhancements Apart from number, padding in title now supports object as well. This object can have separate top, bottom, left and right paddings. fallingColor is introduced in candlestick chart.
CanvasJS v1.9.10 GA Released
Today we are releasing 1.9.10 GA with a bug fix. Below is a summary of the release. Bug Fixes: In few cases, line was overshooting in line and area charts. We’ll be adding several new features in the coming releases. So keep an eye on this section! Do download the latest version from our
CanvasJS v1.9.9 GA Released
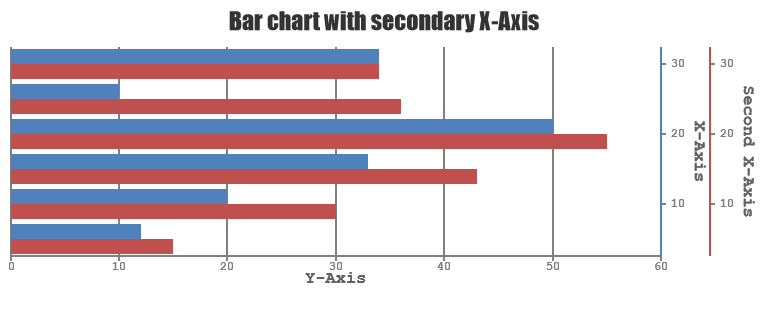
Today we are releasing 1.9.9 GA with few bug fixes. Below is a summary of the release. Bug Fixes: In Line Chart, nullDataLineDashType was not working as expected in some cases. In few cases, Chart was throwing error when no dataPoints were present. When multiple secondary axisX were used, axis titles were not positioned
CanvasJS v1.9.8.1 goes GA
Today we are releasing 1.9.8.1 GA with a new feature and few bug fixes. Below is a summary of the release. New Features destroy method has been added which allows you to clear the memory allocated for charts in the browser. Bug Fix: indexLabels were not positioned correctly in stackedArea100 charts. In case
CanvasJS v1.9.7 GA Released
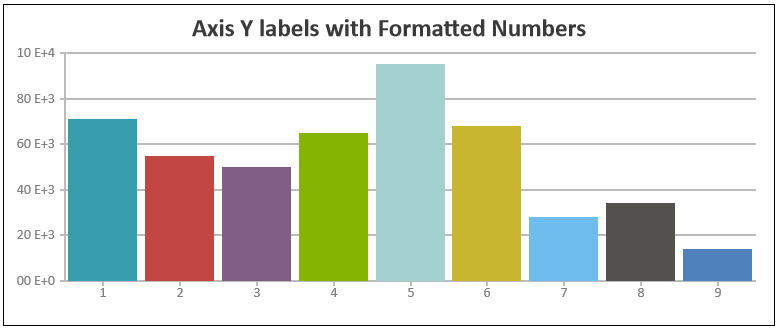
Today we are releasing 1.9.7 GA with a few bug fixes. Below is a summary of the release. Bug Fix: addTo() method was throwing error for secondary axes. In few cases of exponential values, valueFormatString was not formatting values as expected. Do download the latest version from our download page and let us
CanvasJS v1.9.6 goes GA
Today we are releasing 1.9.6 GA. Below is a summary of this release. Highlight of Version 1.9.6 New Methods and Properties have been added which allows you to programmatically export chart as image, print chart, access internally calculated values, etc. You can also access Chart Elements like Title, Axis, DataSeries, ToolTip, Legend, etc using