Login to Ask a Question or Reply
Forum Replies Created by Vishwas R
-
Sorry, we were working on some major features like multiple axes. We will look into this issue and get back to you at the earliest.
Aggaton,
Sorry, this feature is not available as of now. But in coming days, we will be exposing chart properties using which you can solve this issue.
Rohan,
Sorry this feature is not available as of now. But with few lines of jQuery code you can achieve this. Please check this jsfiddle.
Sathya,
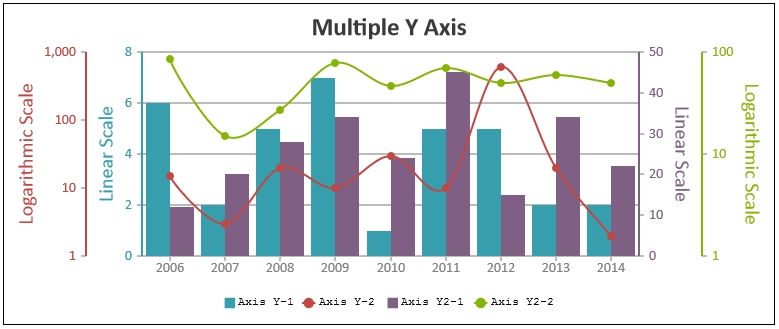
We have just released v1.9.5 Beta which supports Secondary X Axis and Multiple X / Y Axis. Please refer to the release blog for more information.
Alex,
We have just released v1.9.5 Beta which supports Secondary X Axis and Multiple X / Y Axis. Please refer to the release blog for more information.
October 18, 2016 at 12:02 am in reply to: multiple value axes and line chart with different color #12851[Update]
Hi,We have just released v1.9.5 Beta which supports Secondary X Axis and Multiple X / Y Axis. Please refer to the release blog for more information.

—
Vishwas RB. Jansen,
Thanks for reporting. We have fixed the issue and releasing in couple of days.
—
Vishwas ROctober 15, 2016 at 10:19 am in reply to: Using StackedArea100 % chart not covering full background #12750Akshada,
Sorry, as of now its not possible to access plotArea through css or to make plotArea cover the whole canvas. But giving user control over the padding to the entire chart/canvas is in our roadmap.
For security reasons, browsers restrict cross-origin requests. Please refer stackOverflow for more information.
October 13, 2016 at 7:58 pm in reply to: Using StackedArea100 % chart not covering full background #12739October 13, 2016 at 6:12 pm in reply to: Changing decimal point into comma in combination with #total #12737Jansen,
Please refer to yValueFormatString documentation.—
Vishwas R
Team CanvasJSDimas,
Yes its possible to set color at dataPoint level. In your case, you can set the color at datapoint level while parsing the JSON data. Please find the code-snippet for the same below.
for (var i = 0; i <= data.length - 1; i++) {
	var color = null;
	if (data[i].status != 1)
	  color = "red";

	dataPoints.push({
	  label: data[i].region,
	  y: parseInt(data[i].status),
	  color: color
	});
}
Please check this JSFiddle for working code.

—
Vishwas R
Team CanvasJSOctober 13, 2016 at 10:26 am in reply to: Setting custom Interval in XYY Line chart fails to render anything #12721Jason C,
We are unable to reproduce the issue. Can you please create a jsfiddle with the issue, so that we can look into it and help you out.