Json:
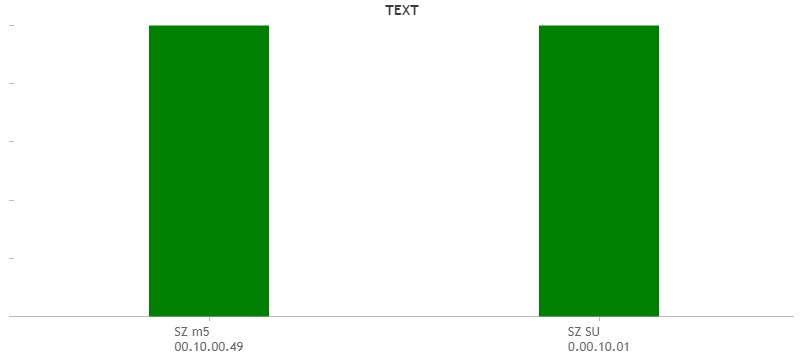
[{"region":"SZ m5 00.10.00.49","status":"1"},{"region":"SZ SU 0.00.10.01","status":"1"}]
code:
<script type="text/javascript">
$(document).ready(function(){
function sec() {
var dataPoints =[];
$.getJSON("api_status.php",function(data) {
for(var i=0; i<= data.length-1; i++) {
dataPoints.push({label:data[i].region,y:parseInt(data[i].status)});
}
var chart = new CanvasJS.Chart("chartContainer", {
theme: "theme2",
zoomEnabled: true,
panEnabled: true,
title: {
fontSize: 14,
text: "TEXT"
},
axisY:{
 valueFormatString: " ",
 maximum: 1,
 gridThickness: 0,
     },
axisX: {
labelMaxWidth: 80,
labelWrap: true,
	},
legend: {
itemMaxWidth: 150,
itemWrap: true,
maxWidth: 100
},
data: [
{
type: "column",
color: "green",
showInLegend: false,
dataPoints: dataPoints
}
]
});
chart.render();
});
}
setInterval(sec, 10000)
});
</script>
If JSON “status”: “2” (example { “region”: “SZ SU 0.00.10.01”, “status”: “2”}) as a color change on the other?
.