Login to Ask a Question or Reply
Forum Replies Created by Vishwas R
-
There is no such restrictions on rendering of number of charts in a page, please take a look at this tutorial on rendering multiple charts in a page for more info. Can you kindly share the sample code in JSFiddle reproducing the issue you are facing so that we can look into it and help you out?
—
Vishwas R
Team CanvasJSCanvasJS supports multi-series area charts. Please take a look at these gallery examples on Multi Series Area Chart and Multi Series Spline Area Chart. If these examples doesn’t help you create chart according to your requirements, kindly share JSFiddle or pictorial representation of your requirements so that we can understand it better and guide you accordingly.
—
Vishwas R
Team CanvasJSHandling the ratio of the chart’s height and firing event at proper pixel co-ordinate should work fine in this case. Please take a look at this updated JSFiddle.

—
Vishwas R
Team CanvasJSI need the same hover effect on Canvas js bar graph.
https://jsfiddle.net/alidingling/30763kr7/You can achieve this either using stripLines as shown in this JSFiddle or crosshair as shown in this JSFiddle.
-> initially bars will be hidden
-> on hover bars, it will display the hovered bar only.Please take a look at this JSFiddle.
—
Vishwas R
Team CanvasJS@prem123,
Are you looking for something like this.Also take a look at gallery example on draggable column chart.
—
Vishwas R
Team CanvasJSPlease take a look at this sample. You can download PHP samples from our download page, which you can try running on local machine.
—
Vishwas R
Team CanvasJSGlad that you figured it out and made it work according to your requirement :)
yValueFormatString formats the values to be displayed in indexLabel and toolTip.
—
Vishwas R
Team CanvasJSInstead of setting chart-height within chart-options, you can set the height of chart-container as per your requirements and render chart on slid.bs.carousel event. Please take a look at this updated JSFiddle.
—
Vishwas R
Team CanvasJSFixing the width of label is not available as of now. However with the help of labelFormatter you can fix the number of characters to be shown in the label. Please take a look at this updated JSFiddle.
—
Vishwas R
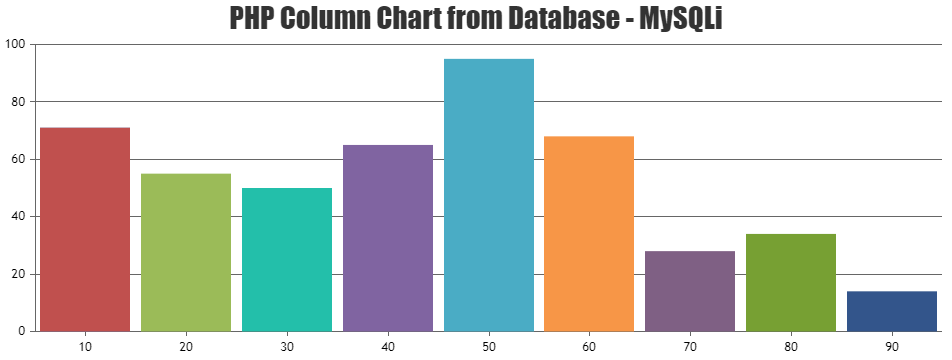
Team CanvasJSYou can retrieve the data points from the database and pass it on chart options as shown in below code snippet.
<?php
$dataPoints = array();

$con=mysqli_connect("localhost","root","","test"); //mysqli_connect("host","username","password","db"); - Refer https://www.w3schools.com/php/func_mysqli_connect.asp for more info

if (mysqli_connect_errno()) {
	echo "Failed to connect to MySQL: " . mysqli_connect_error();
}
$sql="SELECT xval,yval FROM datapoints";

if ($result=mysqli_query($con,$sql)){
	foreach($result as $row){
		array_push($dataPoints, array("x"=> $row["xval"], "y"=> $row["yval"]));
	}
}

mysqli_close($con);
?>

<!DOCTYPE HTML>
<html>
<head>
<script>
window.onload = function () {
	var chart = new CanvasJS.Chart("chartContainer", {
		animationEnabled: true,
		exportEnabled: true,
		theme: "light1", // "light1", "light2", "dark1", "dark2"
        exportEnabled: true,
		title:{
			text: "PHP Column Chart from Database - MySQLi"
		},
		data: [{
			type: "column", //change type to bar, line, area, pie, etc
			dataPoints: <?php echo json_encode($dataPoints, JSON_NUMERIC_CHECK); ?>
		}]
	});
	chart.render();
}
</script>
</head>
<body>
	<div id="chartContainer" style="height: 360px; width: 50%; margin: auto;"></div>
	<script src="https://cdn.canvasjs.com/canvasjs.min.js"></script>
</body>
</html>
Please take a look at this Sample Project for complete working sample.
—
Vishwas R
Team CanvasJS