Login to Ask a Question or Reply
You must be logged in to post your query.
Home › Forums › Chart Support › using database data to draw charts
using database data to draw charts
- This topic has 5 replies, 4 voices, and was last updated 3 years, 7 months ago by
Vishwas R.
-
September 19, 2018 at 7:15 pm #22672
hi, I want to draw a column chart representing the number of male and female registered by deriving that data from my database table, how should i go about it please?
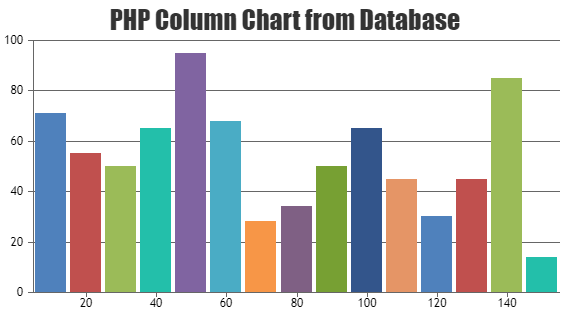
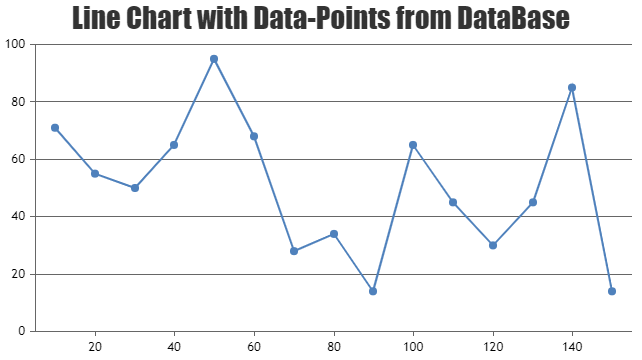
September 20, 2018 at 9:51 am #22675If you are integrating CanvasJS with PHP, please take a look at this example on rendering chart data from database.
If integrating with ASP.NET, please take a look at these step-by-step instructions in our documentation on adding data to chart from the database.
__
Priyanka M S
Team CanvasJSSeptember 21, 2018 at 12:41 pm #22697@priyanka M S
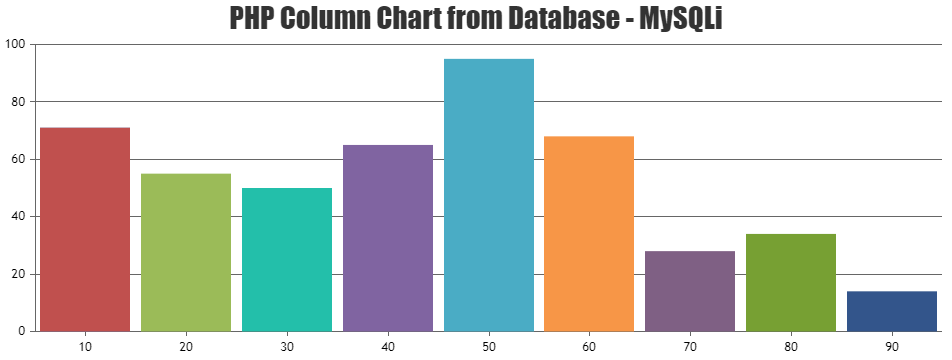
thanks for that but I am using mysqli , any mysqli exapmle please?September 25, 2018 at 11:00 am #22735You can retrieve the data points from the database and pass it on chart options as shown in below code snippet.
<?php
$dataPoints = array();

$con=mysqli_connect("localhost","root","","test"); //mysqli_connect("host","username","password","db"); - Refer https://www.w3schools.com/php/func_mysqli_connect.asp for more info

if (mysqli_connect_errno()) {
	echo "Failed to connect to MySQL: " . mysqli_connect_error();
}
$sql="SELECT xval,yval FROM datapoints";

if ($result=mysqli_query($con,$sql)){
	foreach($result as $row){
		array_push($dataPoints, array("x"=> $row["xval"], "y"=> $row["yval"]));
	}
}

mysqli_close($con);
?>

<!DOCTYPE HTML>
<html>
<head>
<script>
window.onload = function () {
	var chart = new CanvasJS.Chart("chartContainer", {
		animationEnabled: true,
		exportEnabled: true,
		theme: "light1", // "light1", "light2", "dark1", "dark2"
        exportEnabled: true,
		title:{
			text: "PHP Column Chart from Database - MySQLi"
		},
		data: [{
			type: "column", //change type to bar, line, area, pie, etc
			dataPoints: <?php echo json_encode($dataPoints, JSON_NUMERIC_CHECK); ?>
		}]
	});
	chart.render();
}
</script>
</head>
<body>
	<div id="chartContainer" style="height: 360px; width: 50%; margin: auto;"></div>
	<script src="https://cdn.canvasjs.com/canvasjs.min.js"></script>
</body>
</html>
Please take a look at this Sample Project for complete working sample.
—
Vishwas R
Team CanvasJSDecember 22, 2022 at 9:33 pm #41745This mysqli example is exactly what I am looking for! Thanks.
To expand on it a little bit, what if I had 2 (or more) datasets that I wanted on a line graph? Im having some difficulty determining how to format the data from the database and send to canvasjs. Do I just add a label and include ALL the datapoints in an array and canvasjs is smart enough to know the different labels are different lines?
December 23, 2022 at 6:16 pm #41756Pushing datapoint values to different arrays & passing them in multi-series chart options should work fine in this case. Please find the code snippet below.
<?php
$dataPoints1 = array();
$dataPoints2 = array();

$con=mysqli_connect("localhost","root","","test"); //mysqli_connect("host","username","password","db"); - Refer https://www.w3schools.com/php/func_mysqli_connect.asp for more info

if (mysqli_connect_errno()) {
	echo "Failed to connect to MySQL: " . mysqli_connect_error();
}
$sql="SELECT xval,yval1, yval2 FROM datapoints";

if ($result=mysqli_query($con,$sql)){
	foreach($result as $row){
		array_push($dataPoints1, array("x"=> $row["xval"], "y"=> $row["yval1"]));
		array_push($dataPoints2, array("x"=> $row["xval"], "y"=> $row["yval2"]));}
}

mysqli_close($con);
?>

<!DOCTYPE HTML>
<html>
<head>
<script>
window.onload = function () {
	var chart = new CanvasJS.Chart("chartContainer", {
		animationEnabled: true,
		exportEnabled: true,
		theme: "light1", // "light1", "light2", "dark1", "dark2"
        exportEnabled: true,
		title:{
			text: "PHP Column Chart from Database - MySQLi"
		},
		data: [{
			type: "column", //change type to bar, line, area, pie, etc
			dataPoints: <?php echo json_encode($dataPoints1, JSON_NUMERIC_CHECK); ?>
		}, {
			type: "column", //change type to bar, line, area, pie, etc
			dataPoints: <?php echo json_encode($dataPoints2, JSON_NUMERIC_CHECK); ?>
		}]
	});
	chart.render();
}
</script>
</head>
<body>
	<div id="chartContainer" style="height: 360px; width: 50%; margin: auto;"></div>
	<script src="https://cdn.canvasjs.com/canvasjs.min.js"></script>
</body>
</html>
—
Vishwas R
Team CanvasJS
You must be logged in to reply to this topic.