Login to Ask a Question or Reply
Forum Replies Created by Vishwas R
-
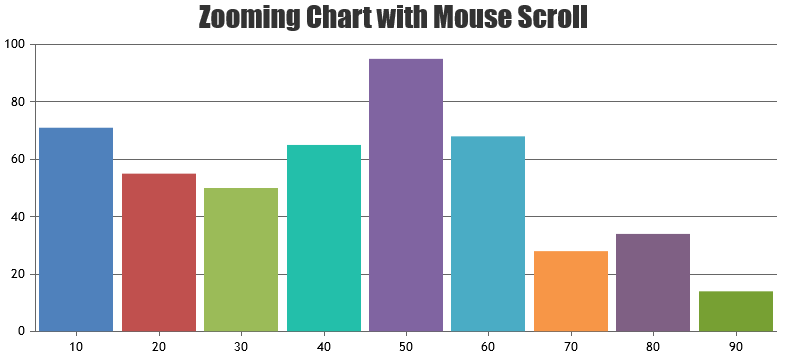
You can zoom the chart using mousewheel by attaching wheel event to the chart. Please find the code snippet below.
document.getElementsByClassName("canvasjs-chart-canvas")[1].addEventListener("wheel", function(e){
  e.preventDefault();

  if(e.clientX < chart.plotArea.x1 || e.clientX > chart.plotArea.x2 || e.clientY < chart.plotArea.y1 || e.clientY > chart.plotArea.y2)
  	return;

  var axisX = chart.axisX[0];
  var viewportMin = axisX.get("viewportMinimum"),
      viewportMax = axisX.get("viewportMaximum"),
      interval = axisX.get("minimum");

  var newViewportMin, newViewportMax;

  if (e.deltaY < 0) {
    newViewportMin = viewportMin + interval;
    newViewportMax = viewportMax - interval;
  }
  else if (e.deltaY > 0) {
    newViewportMin = viewportMin - interval;
    newViewportMax = viewportMax + interval;
  }

  if(newViewportMin >= chart.axisX[0].get("minimum") && newViewportMax <= chart.axisX[0].get("maximum") && (newViewportMax - newViewportMin) > (2 * interval)){
    chart.axisX[0].set("viewportMinimum", newViewportMin, false);
    chart.axisX[0].set("viewportMaximum", newViewportMax);
  }

});
Please take a look at this JSFiddle for complete code.
—
Vishwas R
Team CanvasJSIf you don’t like to use userId and just use customerName from database, you need to parse data received from database accordingly. Here is the updated code for your scenario.
—
Vishwas R
Team CanvasJSNovember 5, 2018 at 12:12 pm in reply to: Auto refresh Graph with some particular time duration #23321In my project it was not displaying any values on graph
I have 2 columns on my table names as stock on x-axis and head in y-axis and name of the table name as db.kpi
Let me know why it was not displaying any dataThe sample project that you have shared is not working as it doesn’t include all dependency files. However when I looked into view (index.cshtml), you seemed to be creating new chart instance on every update. I would suggest you to create chart instance once and update dataPoints on every update and re-render the chart.
I have tried your example again there should be some bugs
If i try to change the any value on database which i have already created is not updating on graph and in the same way delete also not workingWhile updating chart dataPoints, you can empty dataPoints array and update it according to the updated data which you receive from database as shown in this updated sample project.
—
Vishwas R
Team CanvasJSYou can modify SQL query to get the count of status and other parameters accordingly. Please take a look at this updated code where customers and status of the complaints are grouped based on
userId– which is considered as x-value to the dataPoint (In multiseries charts, data-points are grouped based on common x-values).—
Vishwas R
Team CanvasJSPlease take a look at this sample project in ASP.Net MVC which updates chart data every 2seconds (which can be changed as per your requirements) by reading data from database.
Considering this thread as duplicate of Auto refresh Graph with some particular time duration, hence closing it.
—
Vishwas R
Team CanvasJSNovember 2, 2018 at 5:52 pm in reply to: Auto refresh Graph with some particular time duration #23304Please take a look at this sample project in ASP.Net MVC which updates chart data every 2seconds (which can be changed as per your requirements) by reading data from database.
—
Vishwas R
Team CanvasJSI want the labels should come from database and it should plot the graph, according to that particular labels should display the status in the graph,
In multiseries charts, data-points are grouped based on common x-values. Providing same x-values along with labels should work fine in your case.
The sample code provided in the previous reply seems to be working fine as per your requirements. If there are any changes in the code / database, please share the updated code that reproduces the issue you are facing, so that I can look into it and help you resolving it.
—
Vishwas R
Team CanvasJSYou can programmatically zoom / pan to a region by setting viewportMinimum and viewportMaximum. In your case, you can set viewportMaximum to null (which resets the viewportMaximum) when user has zoomed / panned towards the latest dataPoint (latest part of the chart) using rangeChanged event. Please take a look at this JSFiddle.

—
Vishwas R
Team CanvasJSThanks for reporting the use-case. We will look into the issue and fix it in future versions.
To work-around this issue, you can set axis labelFontColor to “transparent” instead of using labelFormatter to hide the axis labels. Please take a look at this updated JSFiddle.
—
Vishwas R
Team CanvasJSI went through the source code of the page that you have shared and observed that, within the
showScript1757, showScript1758 and showScript1759methods, you are instantiating new charts aschart_1757, chart_1758 and chart_1759but calling render method as chart.render() and not chart_1757.render(). Calling render method on instantiated objects should work fine in your case, i.e changingchart.render(); to chart_1757.render();.
—
Vishwas R
Team CanvasJSOctober 31, 2018 at 12:40 pm in reply to: edit stripline and add colors to multiple occurences on the same coordinates #23271Eran,
question 2: how can I delete a marked stripline?
You can remove selected stripLine dynamically using remove method. Please take a look at this JSFiddle where stripLines are deleted dynamically on double clicking them.
question 3: please refer to the following image: https://imgur.com/XI0P34N
I am actually plotting a scatter graph with a lot of data: can I somehow assign a color to a point depending on the number of occurences? Example: if I have 10 points which are equal (same x- & y-axis value), then plot the point yellow, if I have 20 points which are equal, plot the point blue etc.You can set color to the dataPoint based on number of occurrences. Please refer this stackoverflow thread for more info on finding the number of occurrences of an element in an array of objects.
question 1: how can I drag and drop stripline boarders, meaning: I set them with the mouse, and then I want to move the boarders to the left/right
We are looking into this and will get back to you at the earliest.
—
Vishwas R
Team CanvasJSSetting yValueFormatString to “#,###.00” formats y-values in toolTip and indexLabel show only 2 decimal values. Please take a look at this updated JSFiddle.
—
Vishwas R
Team CanvasJSOctober 26, 2018 at 1:31 pm in reply to: how can i get the max, min, avg and current value of any multi series chart #23213The method that calculates the minimum, maximum and other parameters is called only on rangeChanged event because of which table is populated only when you zoom/pan or reset the chart. To populate the table soon after rendering the chart, you need to call the method soon after chart.render().
chart.render();
showTableData(chart);
Please take a look at this Updated JSFiddle.
—
Vishwas R
Team CanvasJSOctober 26, 2018 at 12:06 pm in reply to: how can i get the max, min, avg and current value of any multi series chart #23210The link that you have shared seems to be working fine.
The JSFiddle that was shared earlier was adding 3 rows to the table which can be made generic to add number of rows based on number of dataSeries as shown in this updated JSFiddle.
—
Vishwas R
Team CanvasJS