Login to Ask a Question or Reply
Forum Replies Created by Vishwas R
-
Please refer this documentation-page for step-to-step tutorial on rendering chart from CSV data.
—
Vishwas R
Team CanvasJSCanvasJS supports exporting chart as an image or to print it. To export multiple charts rendered within a page, you can use html2canvas as shown in this JSFiddle, which can be integrated with JavaScript frameworks like Angular, React, etc.
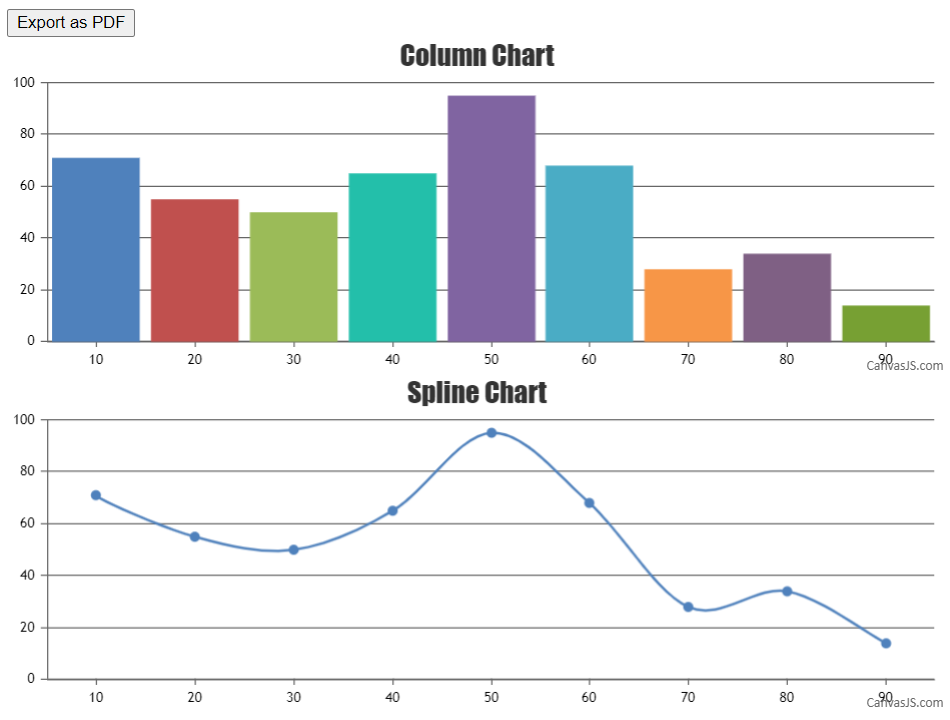
Please refer this article for more info.—
Vishwas R
Team CanvasJSApril 1, 2019 at 1:00 pm in reply to: canvasjs.min.js:209 Uncaught TypeError: Cannot read property 'getTime' of undefi #24785I use a lot of data to create the graph, about 30,000 points, the problem is that if I have few points in the array (example 5,000) this is displayed correctly, but when I have many more it sends this error:
The issue is happening due to the incorrect format of dataPoints being passed to the chart-options. Removing redundant numbers between the objects of dataPoints array should work fine in this case. Please take a look at this Updated JSFiddle.
Format of dataPoints that you have passed:
dataPoints: [{"y": 24},{"y": 24},34,{"y": -315}]Valid Format:
dataPoints: [{"y": 24},{"y": 24},{"y": 34},{"y": -315}]other peculiarity, if I use the php function in example to create random data the graph is displayed.
$ i, “y” => $ y));
}
?>if I use mine it only works with a few points
This is working fine as the format of dataPoints being generated is proper.
—
Vishwas R
Team CanvasJSA logarithmic axis can only plot positive values. There simply is no way to put negative values or zero on a logarithmic axis.
Fundamental: If 10L = Z, then L is the logarithm (base 10) of Z. If L is a negative value, then Z is a positive fraction less than 1.0. If L is zero, then Z equals 1.0. If L is greater than 0, then Z is greater than 1.0. Note that there no value of L will result in a value of Z that is zero or negative. Logarithms are simply not defined for zero or negative numbers.
—
Vishwas R
Team CanvasJSTejal,
Y-Value in toolTip is not being displayed for the value 0.2 due to yValueFormatString that you have set. Setting
yValueFormatString: "$#,##0.#k"should work fine in this case. Please refer documentation for more formatting options available.—
Vishwas R
Team CanvasJSSyncing crosshair across charts is not possible using internal properties, as of now. However the work-around provided is one of the solution that seems to work fine irrespective of number of charts. Please feel free to share any other solution / suggestions to do the same.
—
Vishwas R
Team CanvasJSSorry, sharing chart via Facebook / Twitter is not available as of now. However you can get base64 image of the chart using toDataURL and share it via Facebook / Twitter. Please take a look at this article on Posting HTML5 Canvas Image to Facebook & Twitter for tutorial and code-snippet for the same.
—
Vishwas R
Team CanvasJS[Update]
Syncing Crosshair seems to be working fine in Angular aswell. Please take a look at this Sample Project for the same.
Kindly share sample project reproducing the issue you are facing so that we can look into your code, understand the scenario better and help you resolve it.
—
Vishwas R
Team CanvasJSSyncing crosshair across charts seems to be working fine and we are trying to reproduce the same in Angular 6. Meanwhile, can you kindly create sample project reproducing the issue you are facing and share it with us over Google-Drive or Onedrive, so that we can run it at our end, understand the issue you are facing and help you resolve it?
—
Vishwas R
Team CanvasJSScott,
a) Blank chart.
b) Using Ajax, get data and display on the chart.
c) Get more data from server as in b).Please refer documentation on Live Updating Charts from JSON API & AJAX for step-to-step tutorial on rendering chart with data from server through AJAX call.
Allow data then to be zoomed.
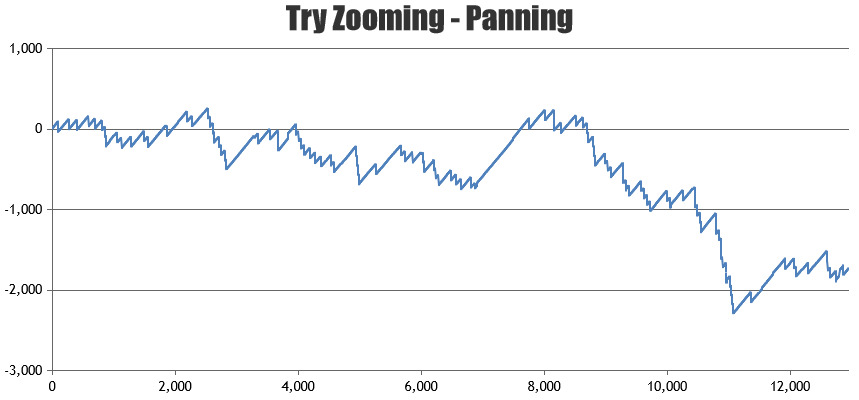
Setting zoomEnabled property to true lets user zoom / pan the chart even in Live Charts.
Allow user to click on chart to create an event so I can see the position the user clicked at.
If you mean clicking on any dataPoint, please refer documentation on click event. Or if you like to click anywhere on the chart, you can bind click event to the chart-container and get to know the position of click. Please take a look at this JSFiddle which shows adding new dataPoint based on user clicked position.
—
Vishwas R
Team CanvasJSDo you mean JSON format of the data that you receive is in different format as [{months: “Jan”, total: 70},…]. If so, parsing it to the format accepted by CanvasJS before passing it to chart-options should work fine in your case. Please take a look at this JSFiddle.
If this doesn’t solve your requirement, kindly create sample project reproducing the issue you are facing, upload it to Google-Drive / Onedrive and share it with us so that we can run the project at our end, understand the scenario better and help you resolve it.
—
Vishwas R
Team CanvasJSCan you kindly create sample project reproducing the issue you are facing, upload it to Google-Drive / Onedrive and share it with us so that we can run the project at our end, understand the scenario better and help you resolve the issue?
—
Vishwas R
Team CanvasJSTrial Version is for evaluation purposes for 30 days which comes with ‘Trial Version’ watermark and ‘CanvasJS’ credit link. To use charts without ‘Trial Version’ and ‘CanvasJS’ Credit Link you will need to have a Commercial Version of CanvasJS. Please checkout License Page for more info & contact sales@canvasjs.com for sales related queries.
—
Vishwas R
Team CanvasJS