Login to Ask a Question or Reply
You must be logged in to post your query.
Home › Forums › Chart Support › chart not rendering
chart not rendering
- This topic has 9 replies, 2 voices, and was last updated 7 years, 4 months ago by
unicorn.
-
February 17, 2019 at 9:58 pm #24361
probForObj = { data:
‘A Ashish Reddy,A Nehra,AD Mathews,AD Russell,AN Ahmed,AR Patel,Ankit Sharma,Anureet Singh,B Kumar,BE Hendricks,CH Morris,D Wiese,DJ Bravo,DJ Hooda,DJ Muthuswami,DR Smith,DS Kulkarni,GB Hog
g,GJ Maxwell,GS Sandhu,Gurkeerat Singh,HH Pandya,HV Patel,Harbhajan Singh,IC Pandey,Imran Tahir,J Suchith,J Theron,JJ Bumrah,JP Duminy,JP Faulkner,KV Sharma,Karanveer Singh,M Vijay,M de Lange,
MA Starc,MC Henriques,MG Johnson,MJ McClenaghan,MM Sharma,NM Coulter-Nile,P Negi,P Suyal,PJ Cummins,PV Tambe,R Ashwin,R Dhawan,R Tewatia,R Vinay Kumar,RA Jadeja,RG More,RS Bopara,S Aravind,S G
opal,SA Abbott,SL Malinga,STR Binny,Sandeep Sharma,Shivam Sharma,TA Boult,TG Southee,UT Yadav,VR Aaron,YS Chahal’,
value:
‘1.1333333333333333,9.164133738601823,1.8444444444444446,3.0458715596330275,2.15,1.8732394366197183,1.8387096774193548,7.014705882352941,1.2251461988304093,4.3076923076923075,1.931034482758
6208,7.5,8.1875,3.8529411764705883,7.714285714285714,11.333333333333334,1.1693548387096775,1.8974358974358974,1.7321428571428572,10.75,4.714285714285714,38.65079365079365,2.8728813559322033,5.
06425702811245,2.923076923076923,2.581967213114754,8.047619047619047,1.0512820512820513,1.0165745856353592,1.1228070175438596,2.013953488372093,1.9425287356321839,4.416666666666667,4.666666666
666667,1.5789473684210527,3,1.0718954248366013,1.7743589743589743,11.707317073170731,10.727969348659004,3.377551020408163,12.682242990654206,5.388888888888889,1.6349206349206349,2.383928571428
5716,3.842239185750636,1.2906976744186047,1.4761904761904763,7.638888888888889,5.871559633027523,10.5,4.555555555555555,1.0076335877862594,1.2105263157894737,11.4,4.541202672605791,1.554347826
0869565,1.6933962264150944,2.3157894736842106,4.0508474576271185,2.217391304347826,1.1415929203539823,1.1920529801324504,2.0492610837438425’ }window.onload = function () {
var dataPoints = [];
for(let i in probForObj){
dataPoints.push({x: probForObj[i].data, y: Math.round(probForObj[i].value)});}
var chart = new CanvasJS.Chart(“chartContainer”,
{
title:{
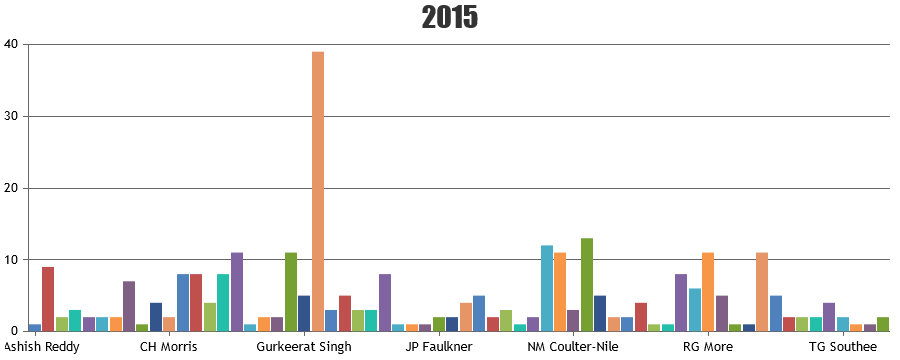
text: “2015”
},axisX: {
labelAngle: 0
},data: [
{
type: “column”,
dataPoints: dataPoints
}
]
});chart.render();
}please help!
February 18, 2019 at 3:58 pm #24371In the code that you have shared, the JSON-format(data and value) doesn’t seems to be proper. Storing names as array of string and values as array of numbers should work fine in this case. Please find the code-snippet for parsing JSON data below.
for(var j = 0; j < probForObj["data"].length; j++){
  dataPoints.push({label: probForObj["data"][j], y: Math.round(probForObj["value"][j])});
}
Please take a look at this JSFiddle for working sample.
—
Vishwas R
Team CanvasJSFebruary 18, 2019 at 7:36 pm #24377Thank you so much :)
February 18, 2019 at 9:00 pm #24380<!DOCTYPE HTML> <html> <head> <script type="text/javascript"> window.onload = function (){ var dataPoints = []; for(var j = 0; j < probForObj["data"].length; j++){ dataPoints.push({label: probForObj["data"][j], y: Math.round(probForObj["value"][j])}); } var chart = new CanvasJS.Chart("chartContainer", { title:{ text: "Top economical bowlers in 2015" }, axisX: { labelAngle: 0 }, data: [{ type: "column", dataPoints: dataPoints }] }); chart.render(); } </script> <script type="text/javascript" src="https://cdn.canvasjs.com/canvasjs.min.js"></script> <script src="ipl.js" type="text/javascript"></script></head> </head> <body> <div id="chartContainer" style="height: 300px; width: 100%;"> </div> </body> </html>I’m using Visual Studio code. It’s not working. Can you tell me what’s wrong please?
February 20, 2019 at 6:34 pm #24403The code that you have shared seems to be working fine, please take a look at this JSFiddle.
If you are still facing issue, kindly share us the static HTML file along with dependencies(ipl.js) over Google-Drive / Onedrive so that we can run your it locally at our end, understand the scenario better and help you resolve.
—
Vishwas R
Team CanvasJSFebruary 20, 2019 at 8:37 pm #24406Here’s the link – https://drive.google.com/drive/folders/1ZHnJuYvrnz8iX884rqgNFSzUDVqr6NV5?usp=sharing
please check
February 21, 2019 at 5:42 pm #24424The sample code that you have shared also seems to be working fine. Can you kindly share the Working Sample Project reproducing the issue you are facing and also kindly brief us what do you mean by ‘not working’? Also can you check browser-console for any error?
—
Vishwas R
Team CanvasJSFebruary 22, 2019 at 10:54 pm #24448I’m getting a blank webpage
Uncaught ReferenceError: require is not defined
at ipl3.js:1
chart3.html:7 Uncaught TypeError: Cannot read property ‘data’ of undefined
at window.onload (chart3.html:7)February 24, 2019 at 4:04 pm #24454The project that you have shared seems to be a node.js project, which would give such error when it’s not run on a server. Please check this tutorial for more information on running node.js project.
—
Vishwas R
Team CanvasJSFebruary 24, 2019 at 6:14 pm #24455Yes!! Thank you
You must be logged in to reply to this topic.